Getting Started - Advanced Tutorial
How to build a KPI alerting workflow from scratch using PushMetrics
In this guide, we build a slightly more sophisticated example of a reporting workflow to illustrate the capabilities of PushMetrics.
In practice, you might rather want to start with one of our templates but for the sake of this example, we will build everything from scratch.
What we will build
In this example, we will
- Get a list of email recipients from a Google Spreadsheet
- Query a set of KPIs and how they changed from our SQL database
- Send a personalized alert email to each recipient from the Google Sheet - but only if a certain threshold is met for their individual numbers
We assume you have a basic understanding of PushMetrics from the first getting started guide.
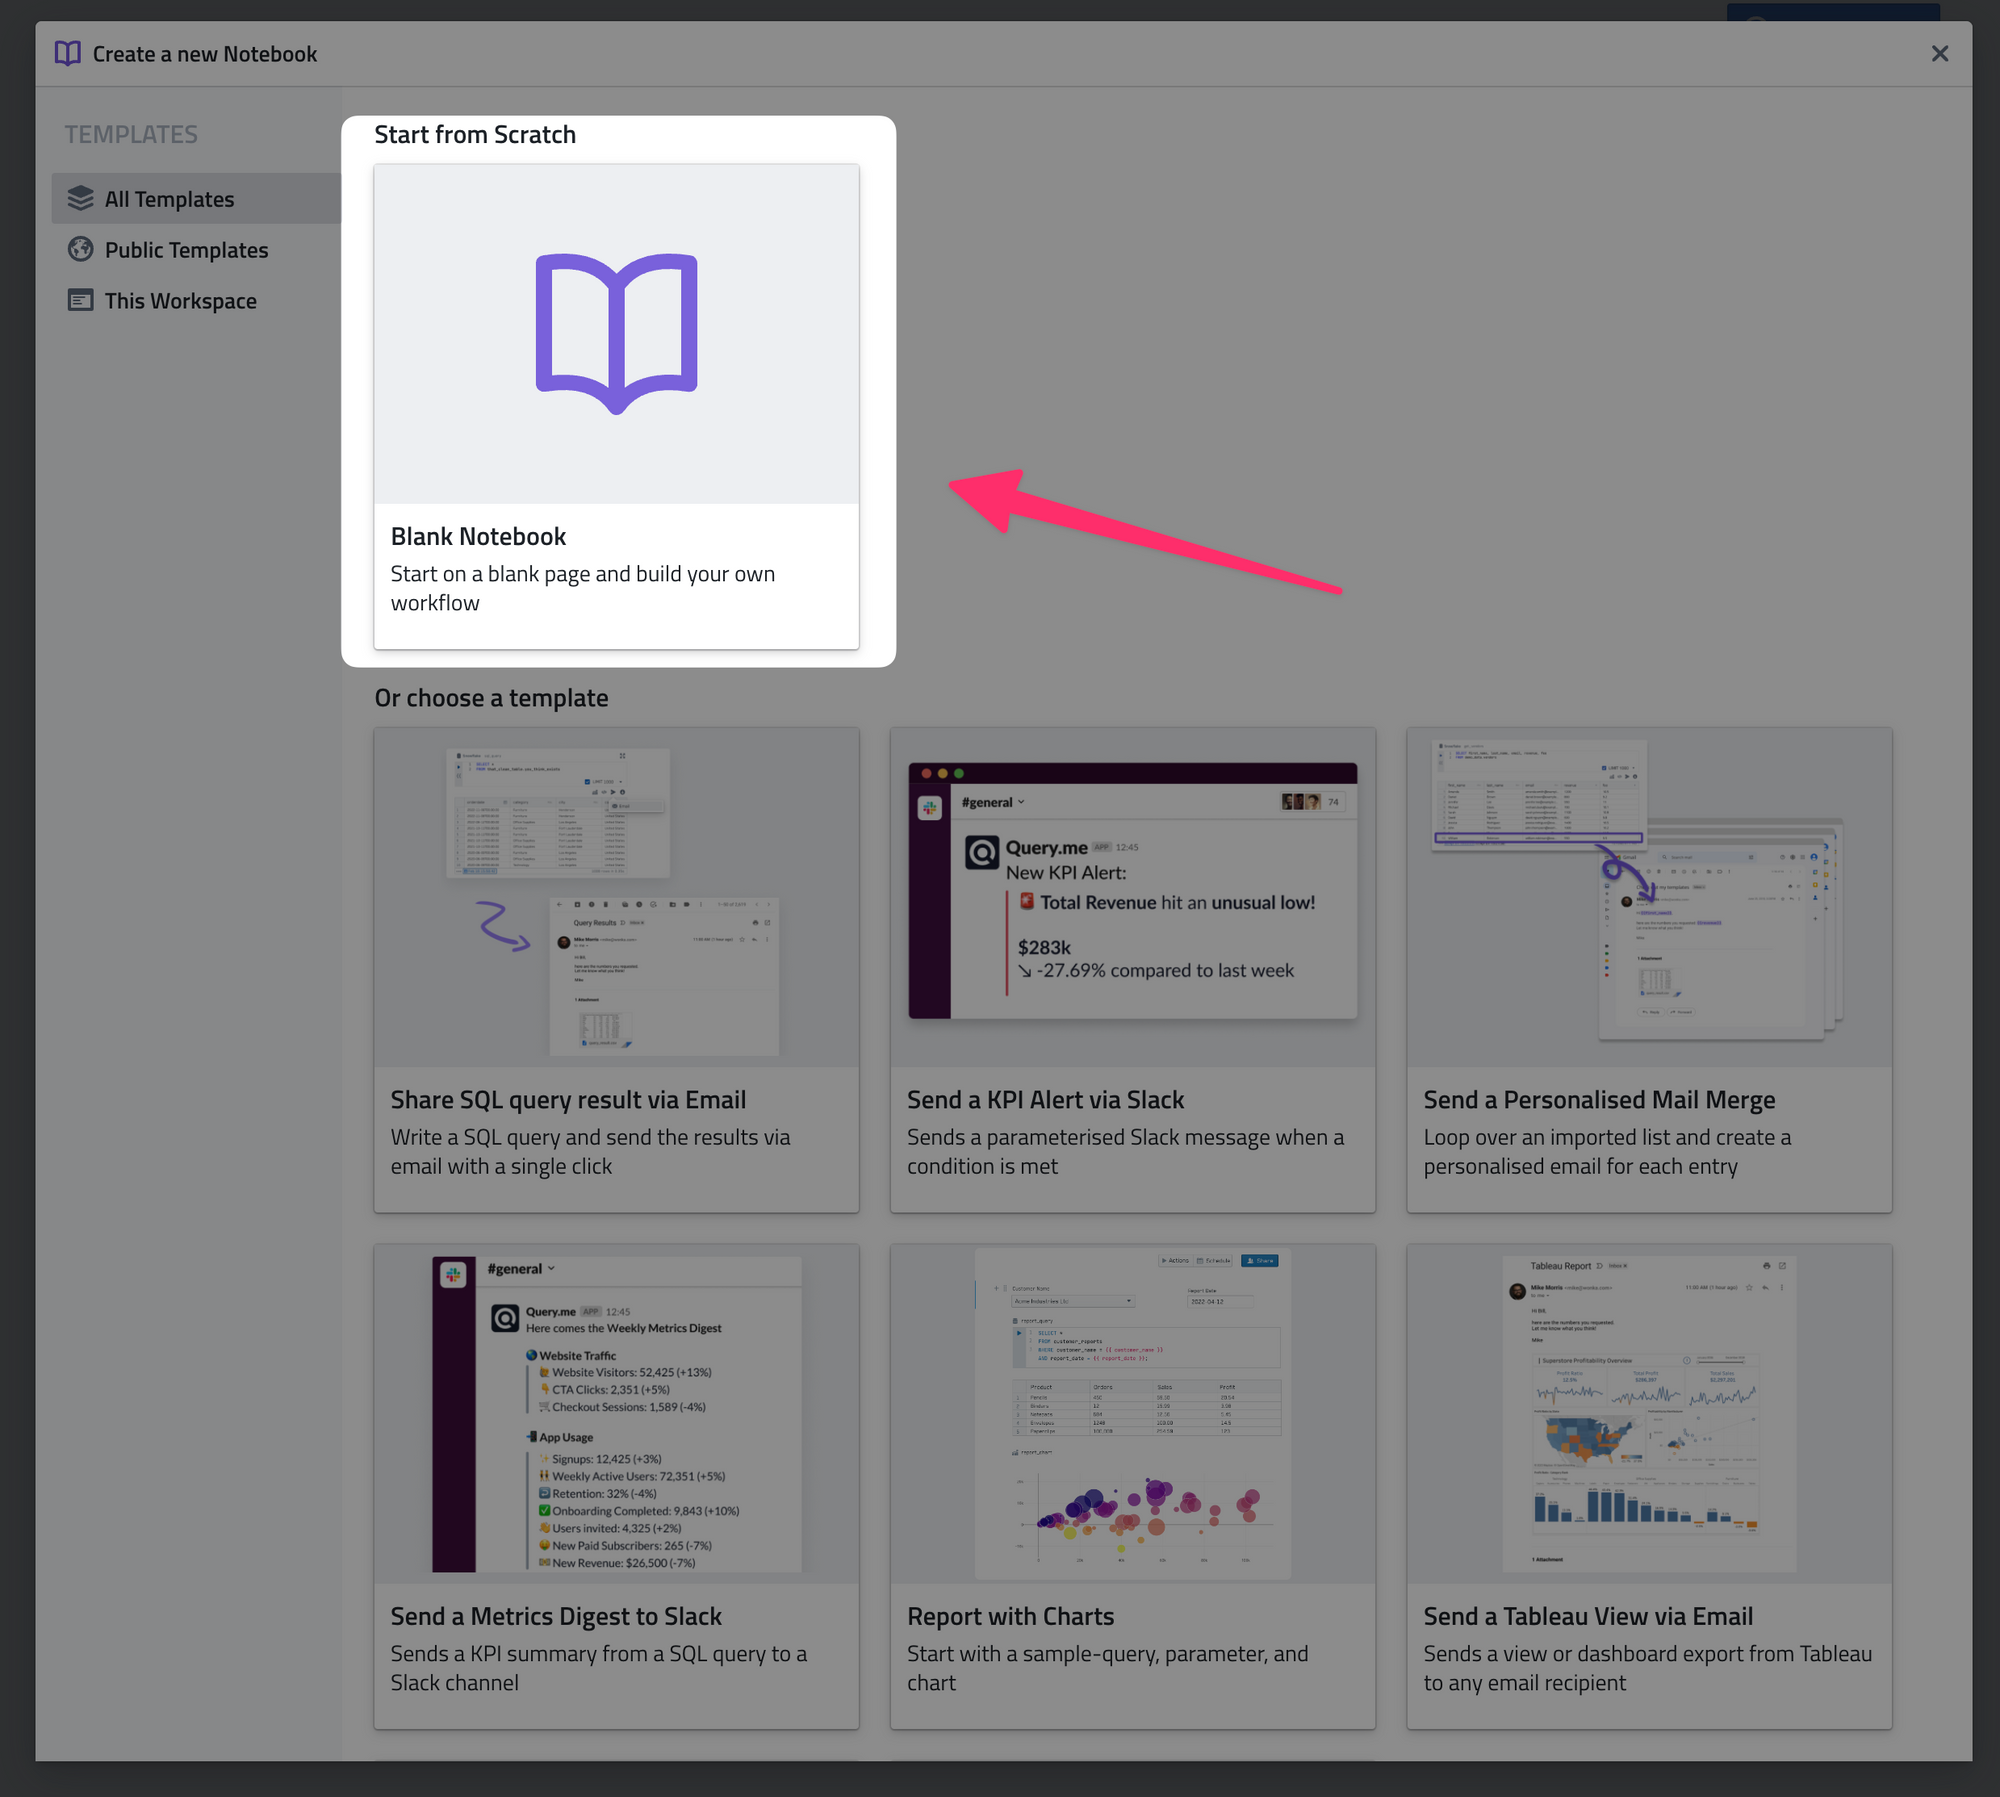
1. Creating a new Notebook
Just like in the first example, we start by creating a blank new Notebook:
2. Getting the recipient list from a Google Sheet
In PushMetrics you can write SQL queries against Google Sheets to both read and write data to it.
In this example, we make use of this to pull a list of users that will become the recipients of our alerts.
Here is the list:
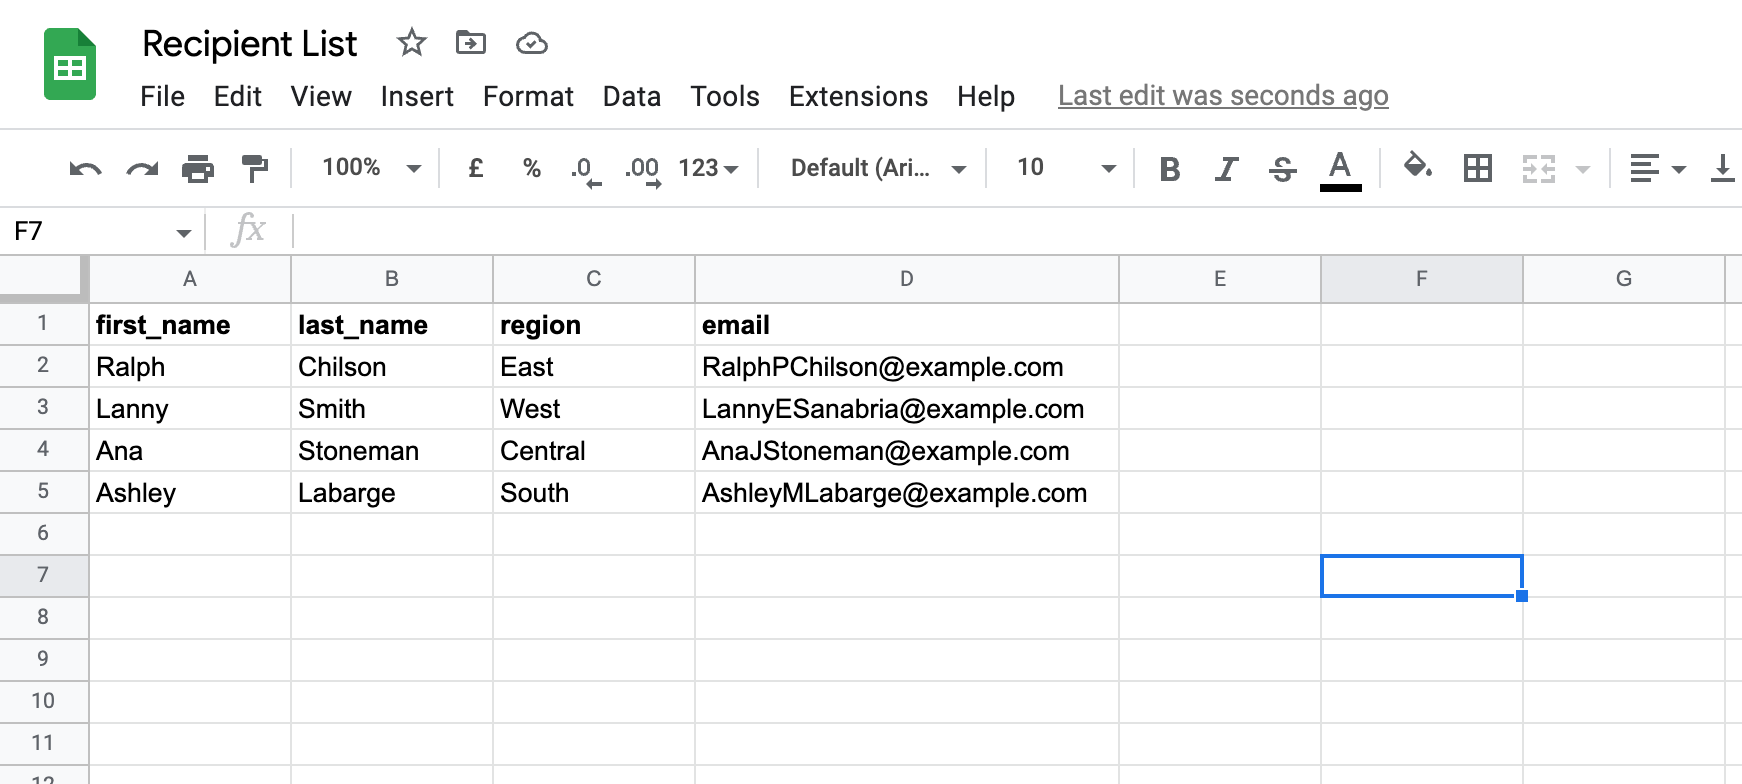
- Each recipient has a region assigned to them which we will use to filter the report
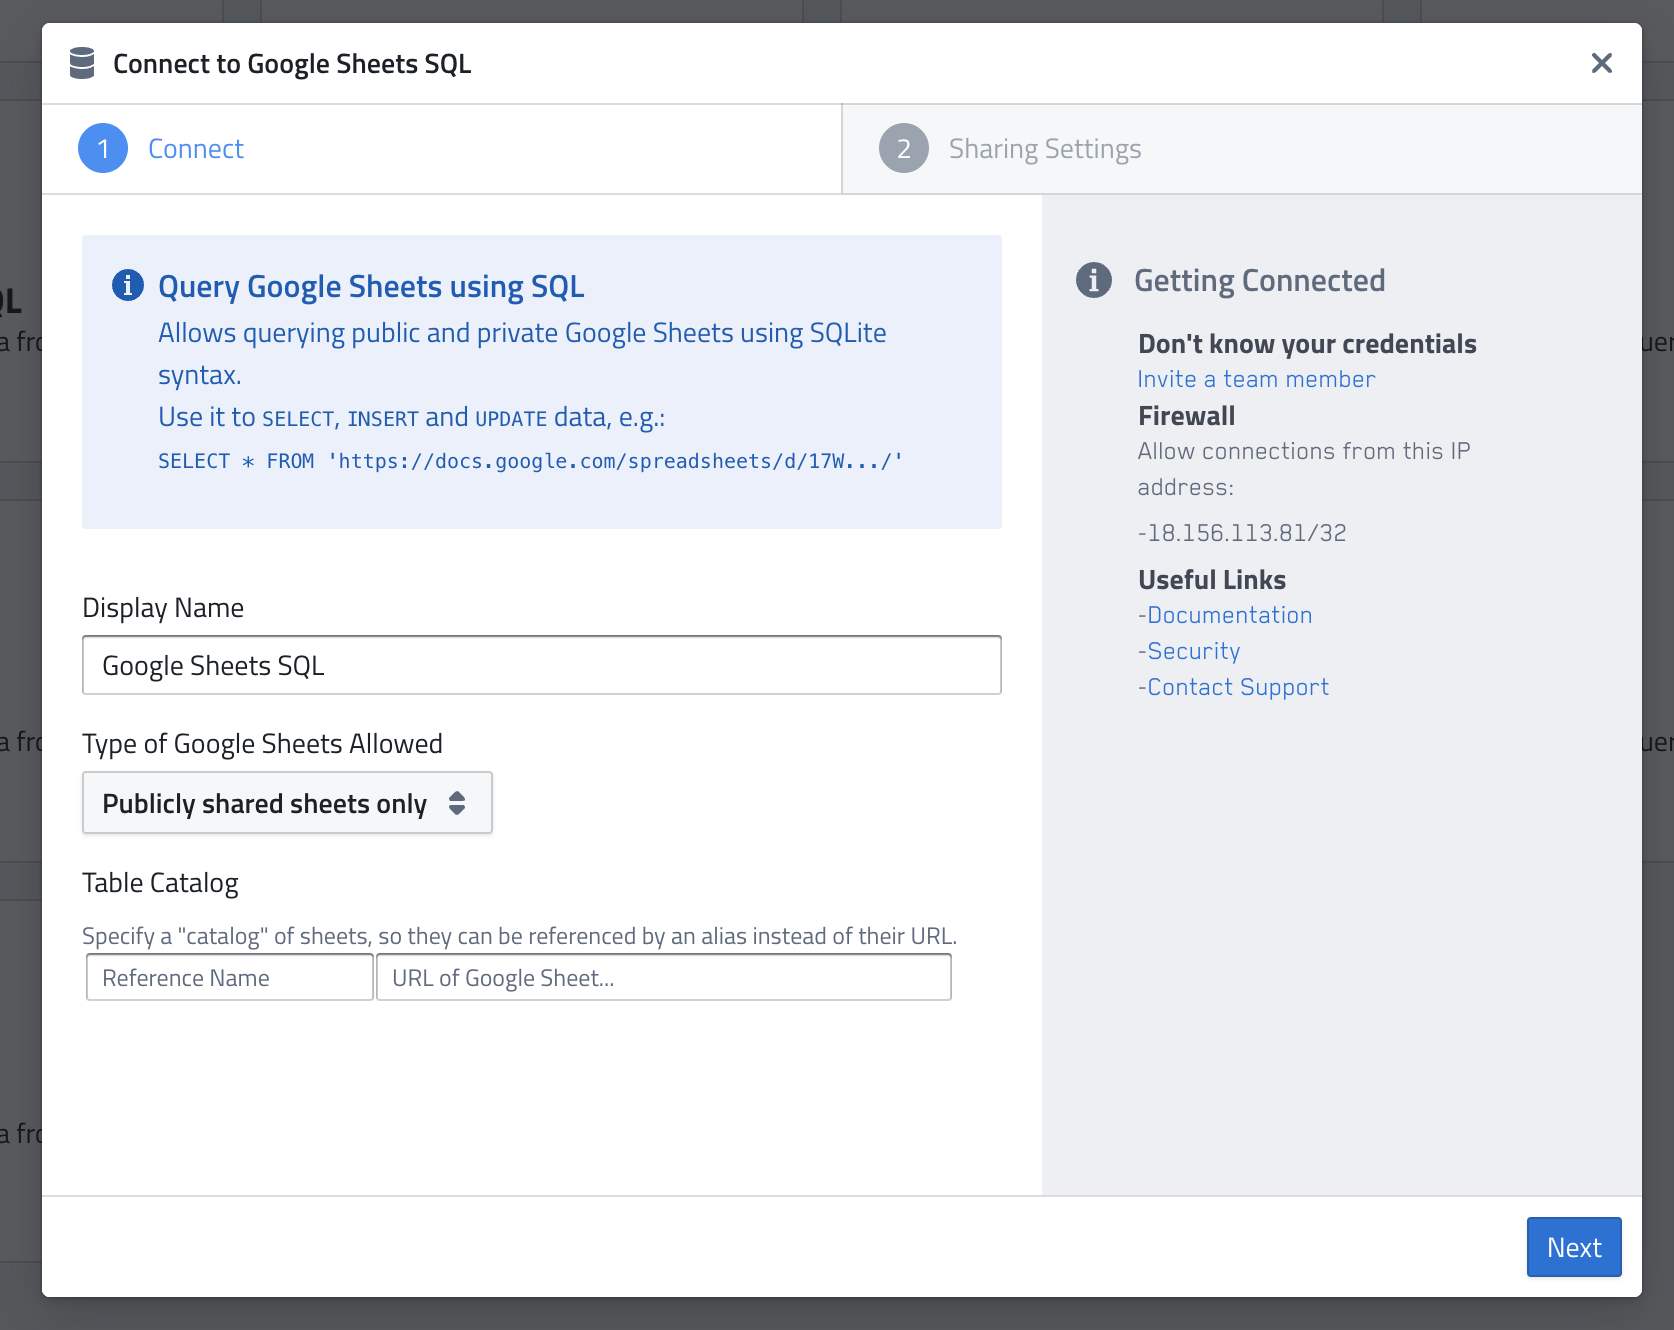
- In order to bring this data into our notebook, we need to first create a Google Sheets connection in PushMetrics.
You can follow the instructions here - it's just 3 clicks. For this example, you only need to query public sheets.
- Once we have the Google Sheets connection established we can head back to our notebook and create a new SQL block, select our Google Sheets connection, and then run queries against it like this:
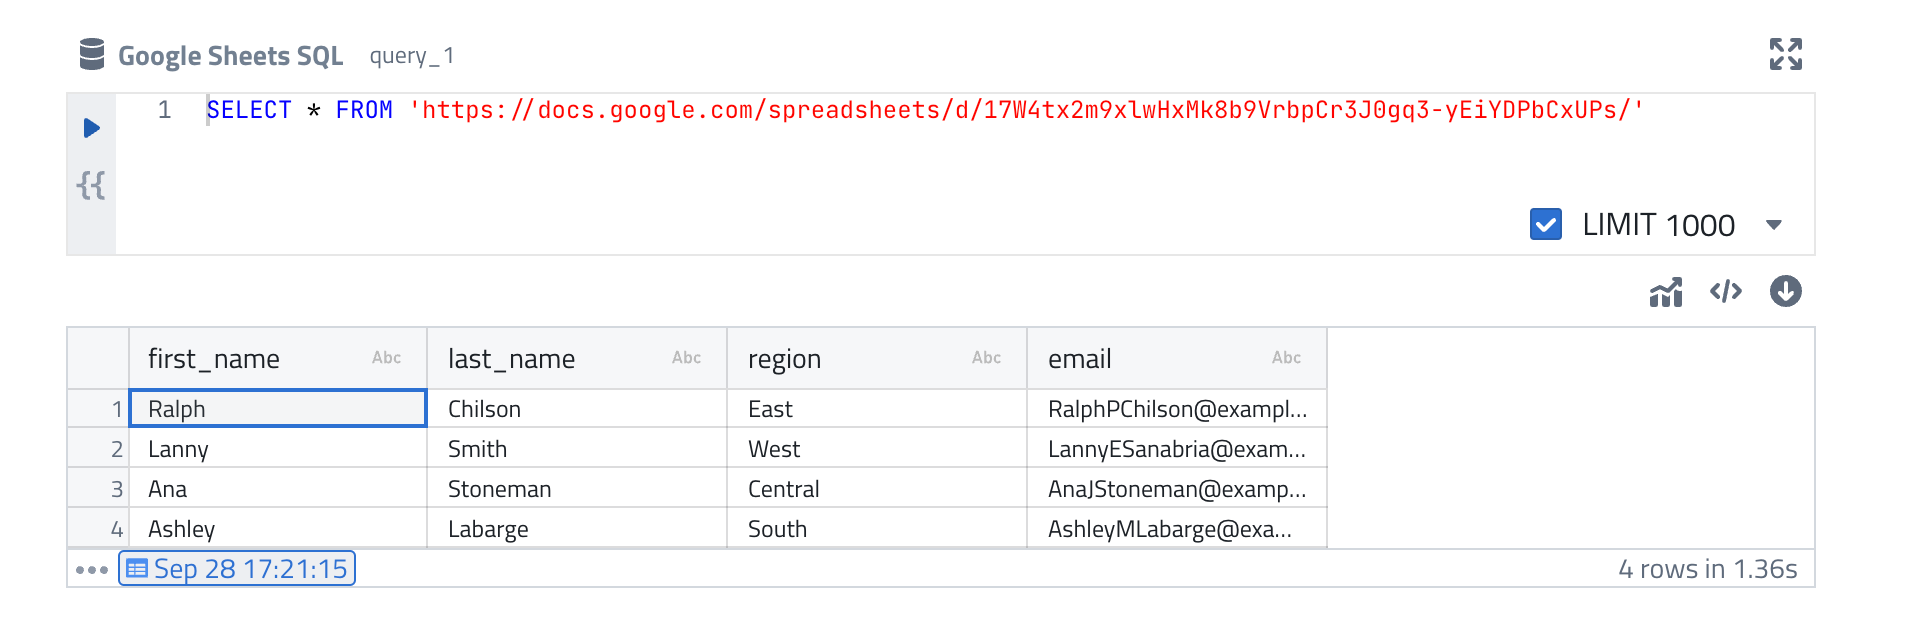
Great, now we have the recipient list from the Google Sheet available in PushMetrics.
3. Creating the KPI report query
Next, we will query the KPIs we want to send out.
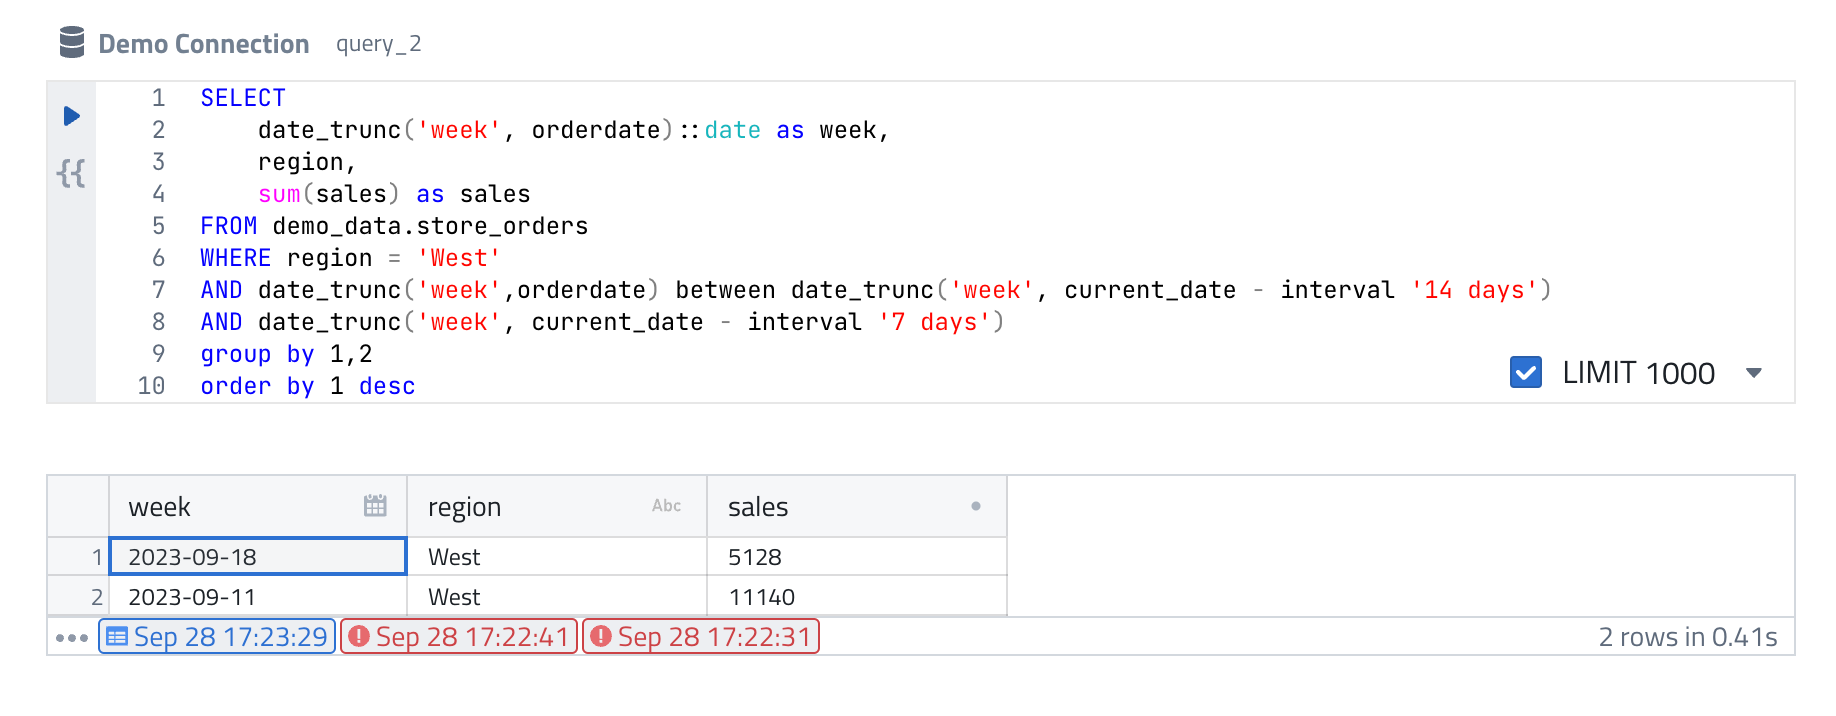
For this, we create a new SQL block like this:
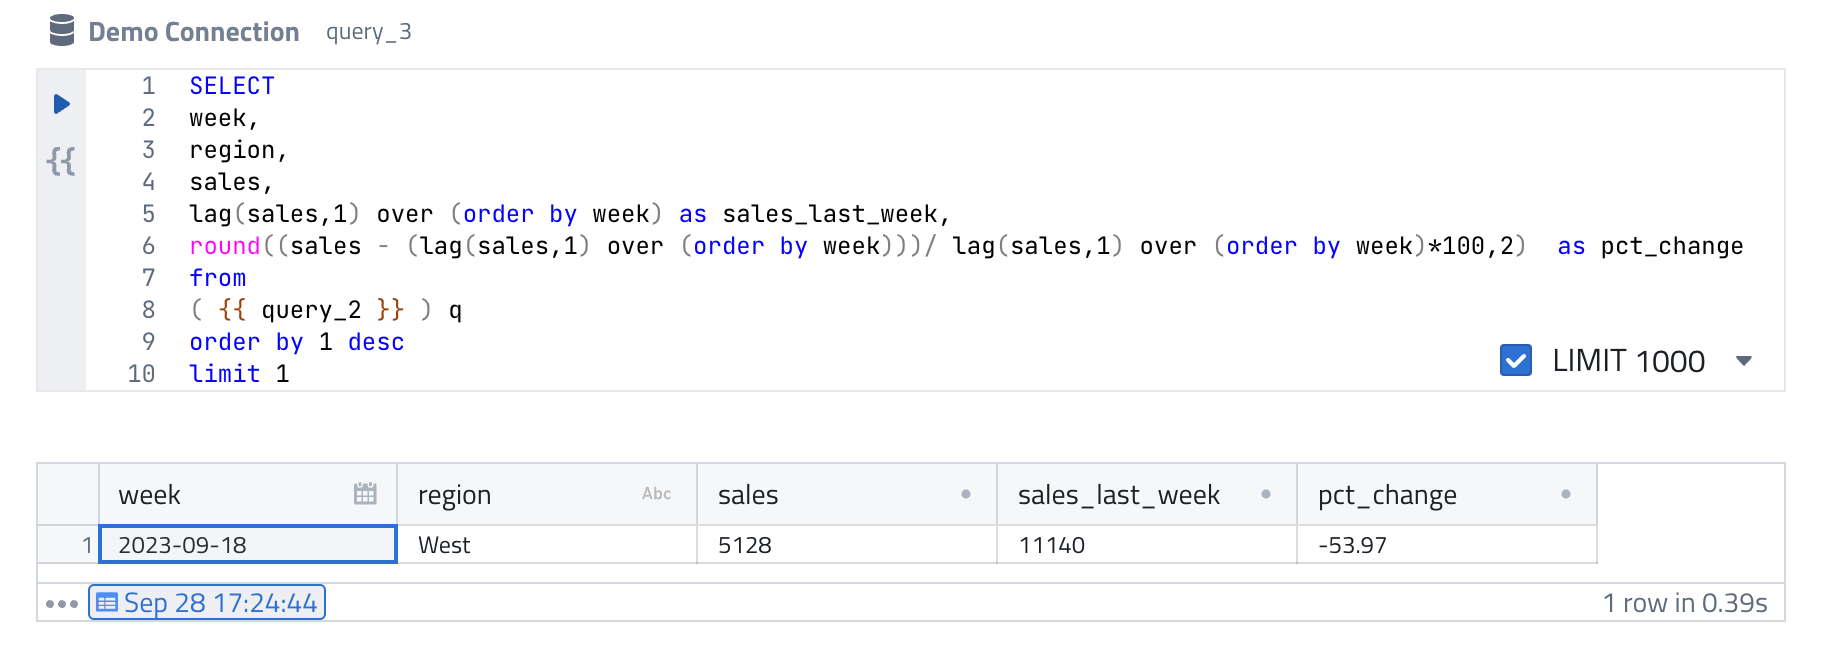
And a second SQL block right below like this:
We don't want to get into the details of the SQL itself but notice this:
- We are querying the Demo Connection database, not the Google Sheet as in the first query. In PushMetrics, you can query multiple databases in one notebook.
- In
query_2we are filtering forregion = 'West'. This is only temporary. We will make this dynamic and filter for the region of each particular recipient from the Google Sheet in the next step. - In
query_3we are selectingfrom( {{ query_2 }} ). Upon execution, the SQL from query_2 will be injected here. Of course, we could cram this into one long query but this illustrates how you can split up complex queries into separate blocks in PushMetrics. - As our final result, we'll receive one row with the sales of last week, the week before, and the percentage change week over week for one region. We will use this data to create our alert rule and the alert email message.
4. Iterating over the recipient list
Right now, we are only generating the report data for region = 'West' but what we actually want is to loop over the recipient list from query_1 and execute the report queries for each of the recipient's regions.
Luckily, this is quite easy in PushMetrics. All we need to do is to wrap the queries inside a FOR LOOP:
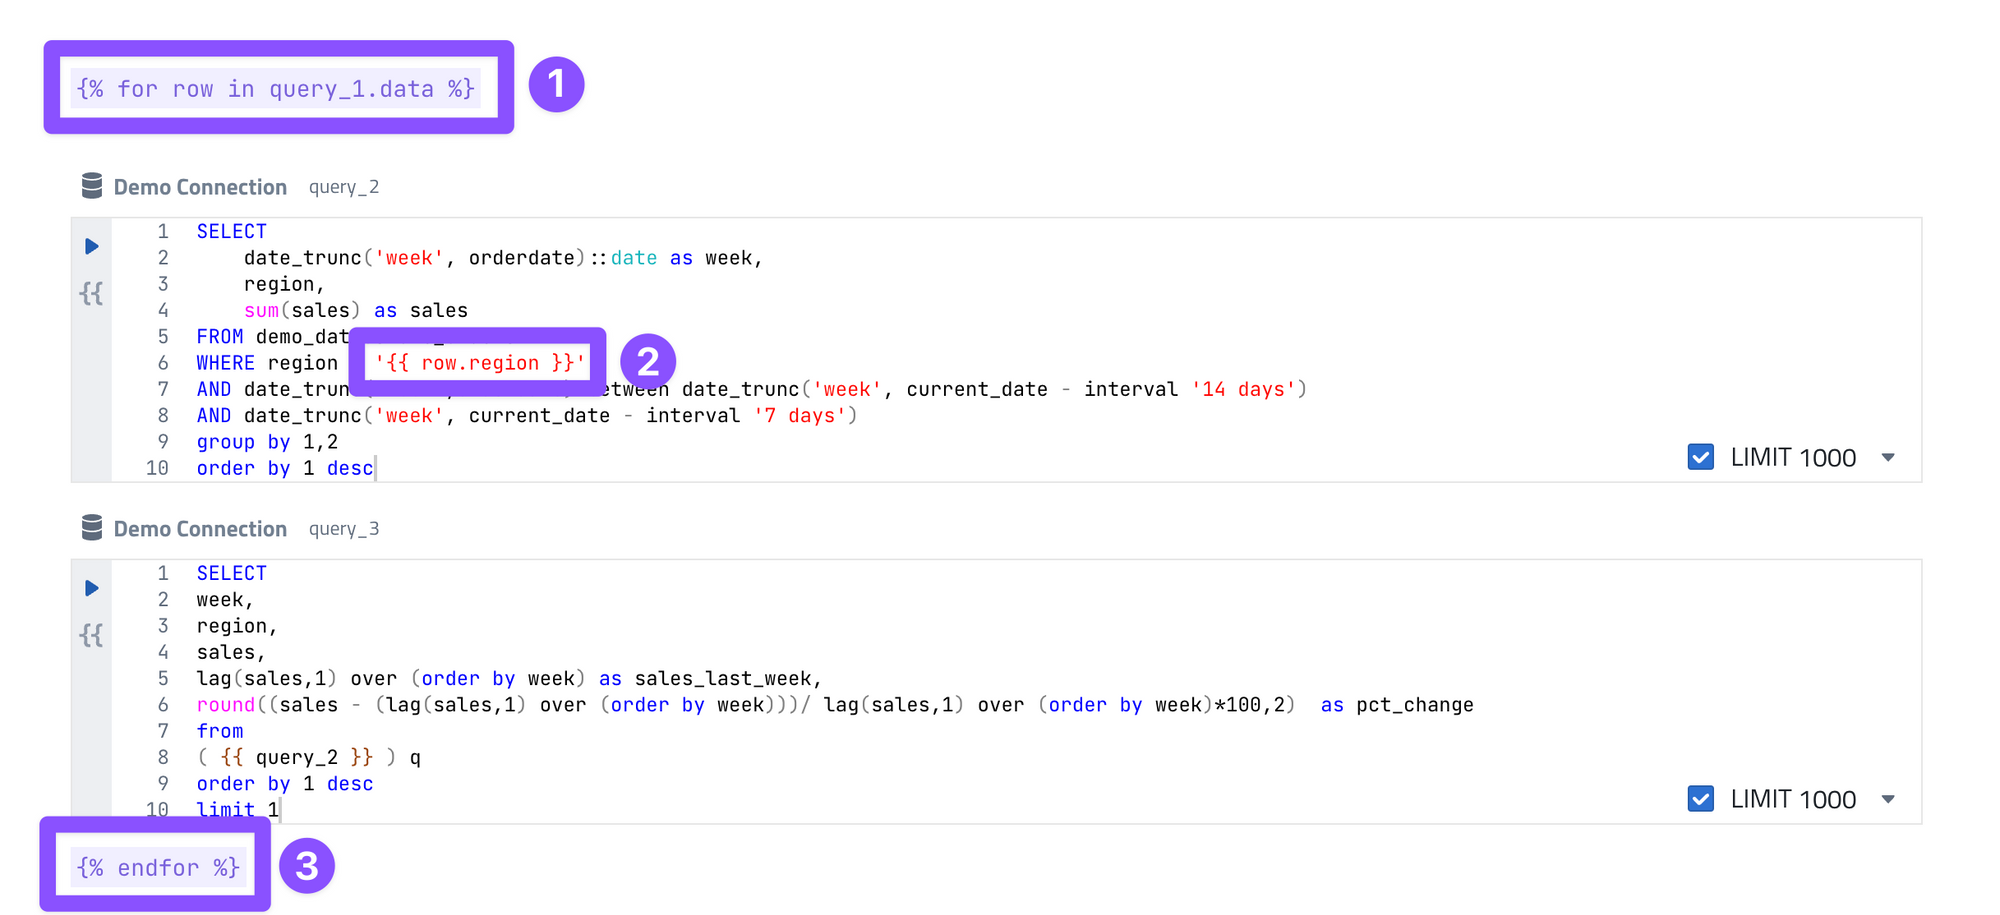
- Above the two SQL blocks, we just type
{% for row in query_1.data %}. This will access the data from the first query that returns us the recipient list from Google Sheets - Below the queries, we simply close the loop by adding
{% endfor %}. - In
query_2we change the filterregion = 'West'toregion = '{{ row.region }}', which will replace the hard-coded "West" with the correct region of each recipient.
On execution, for every row in the recipient list, the queries inside the for loop are executed and the region value is replaced dynamically.
5. Creating the Email message
Now that we have the data we need, and we loop over the recipient list, we can draft a nice email.
But before that, we do one small little tweak that will make our lives a bit easier:
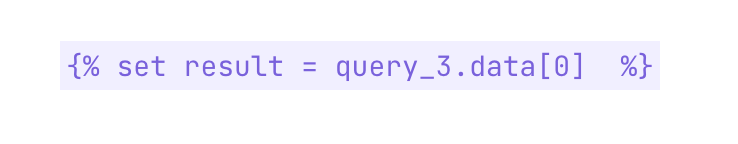
- In a default text block, we write
{% set result = query_3.data[0] %}.
This is assigning the results data of the first row ([0]) ofquery_3to a new variable calledresult
result.sales instead of having to write query_3.data[0].salesNow we are ready to craft our email message:
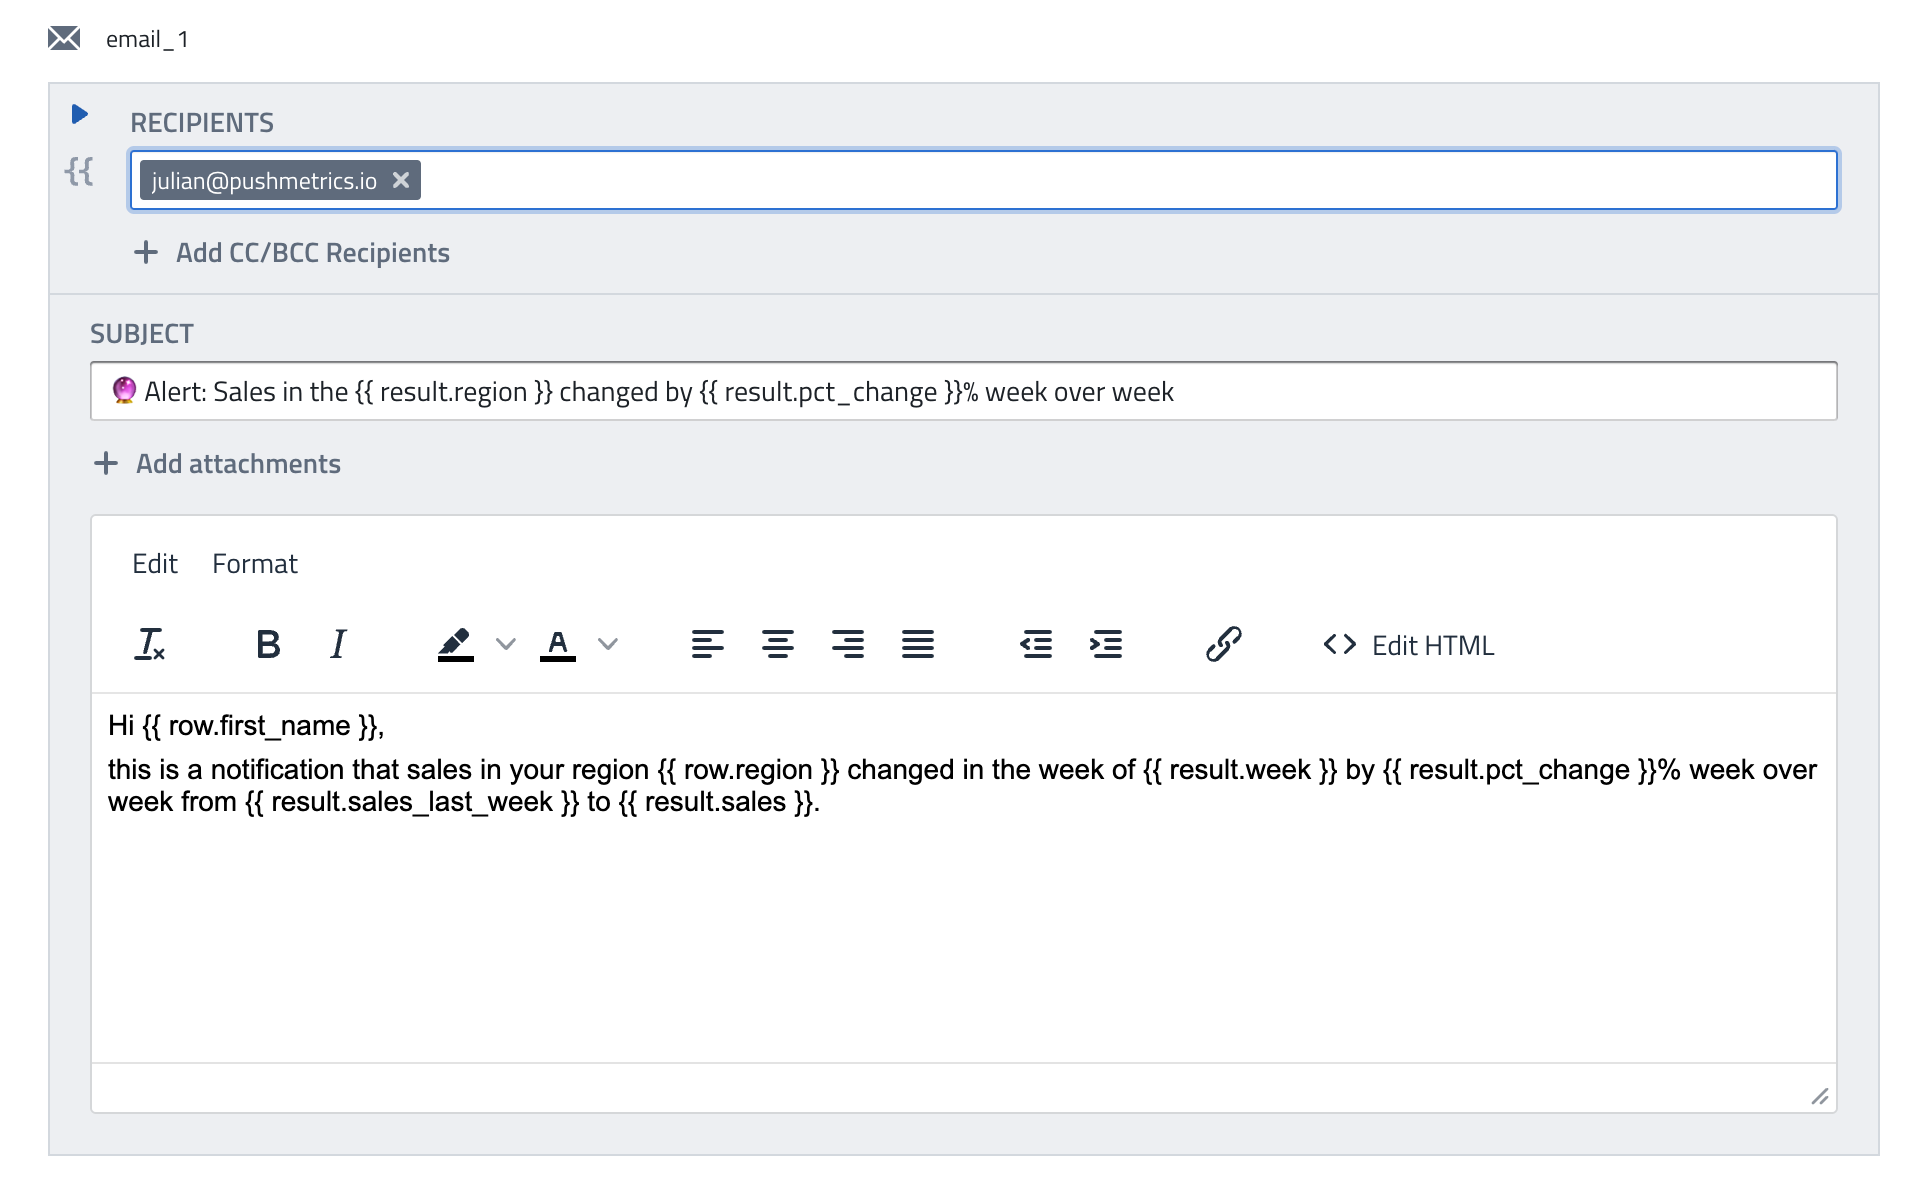
- For this we create an email block and create a dynamic message, combining data from the recipient list (this is the
rowvariable from our loop) and the final report query (query_3, now dubbedresult). - For example, in the sentence
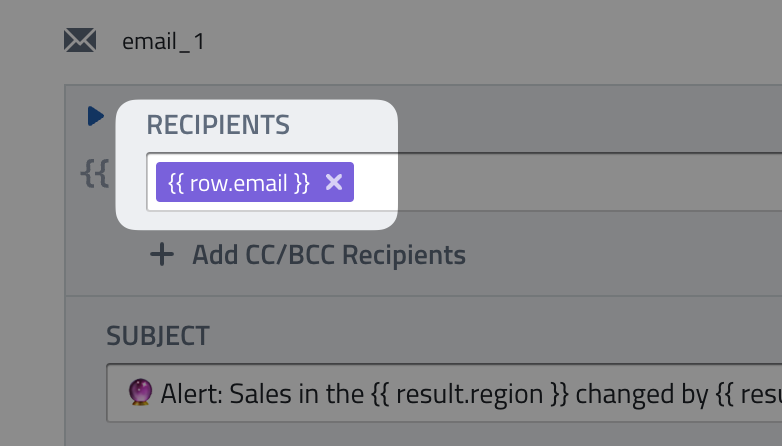
...sales in your region {{ row.region }} changed in the week of {{ result.week }} by {{ result.pct_change }}...the region information comes from the Google sheets data, the week, and the percentage change from the report query. - Notice that for testing purposes I have hard-coded my own email address and added the real recipient's email in the body. Later for production use, I will swap it out like this:
6. Turning it into an alert
Now, this version would already work pretty well as a simple burst report, where every recipient receives a personalized KPI report in their inbox.
However, we only want to send the email IF the change in Sales week over week is above a certain threshold.
For this, we just wrap the email inside an IF statement that checks for our alerting condition:
- First, we create a simple parameter block to define our threshold. This allows us to easily change and adjust this value.

- Next, just like we did with the
for loopbefore, we wrap our email inside anifstatement
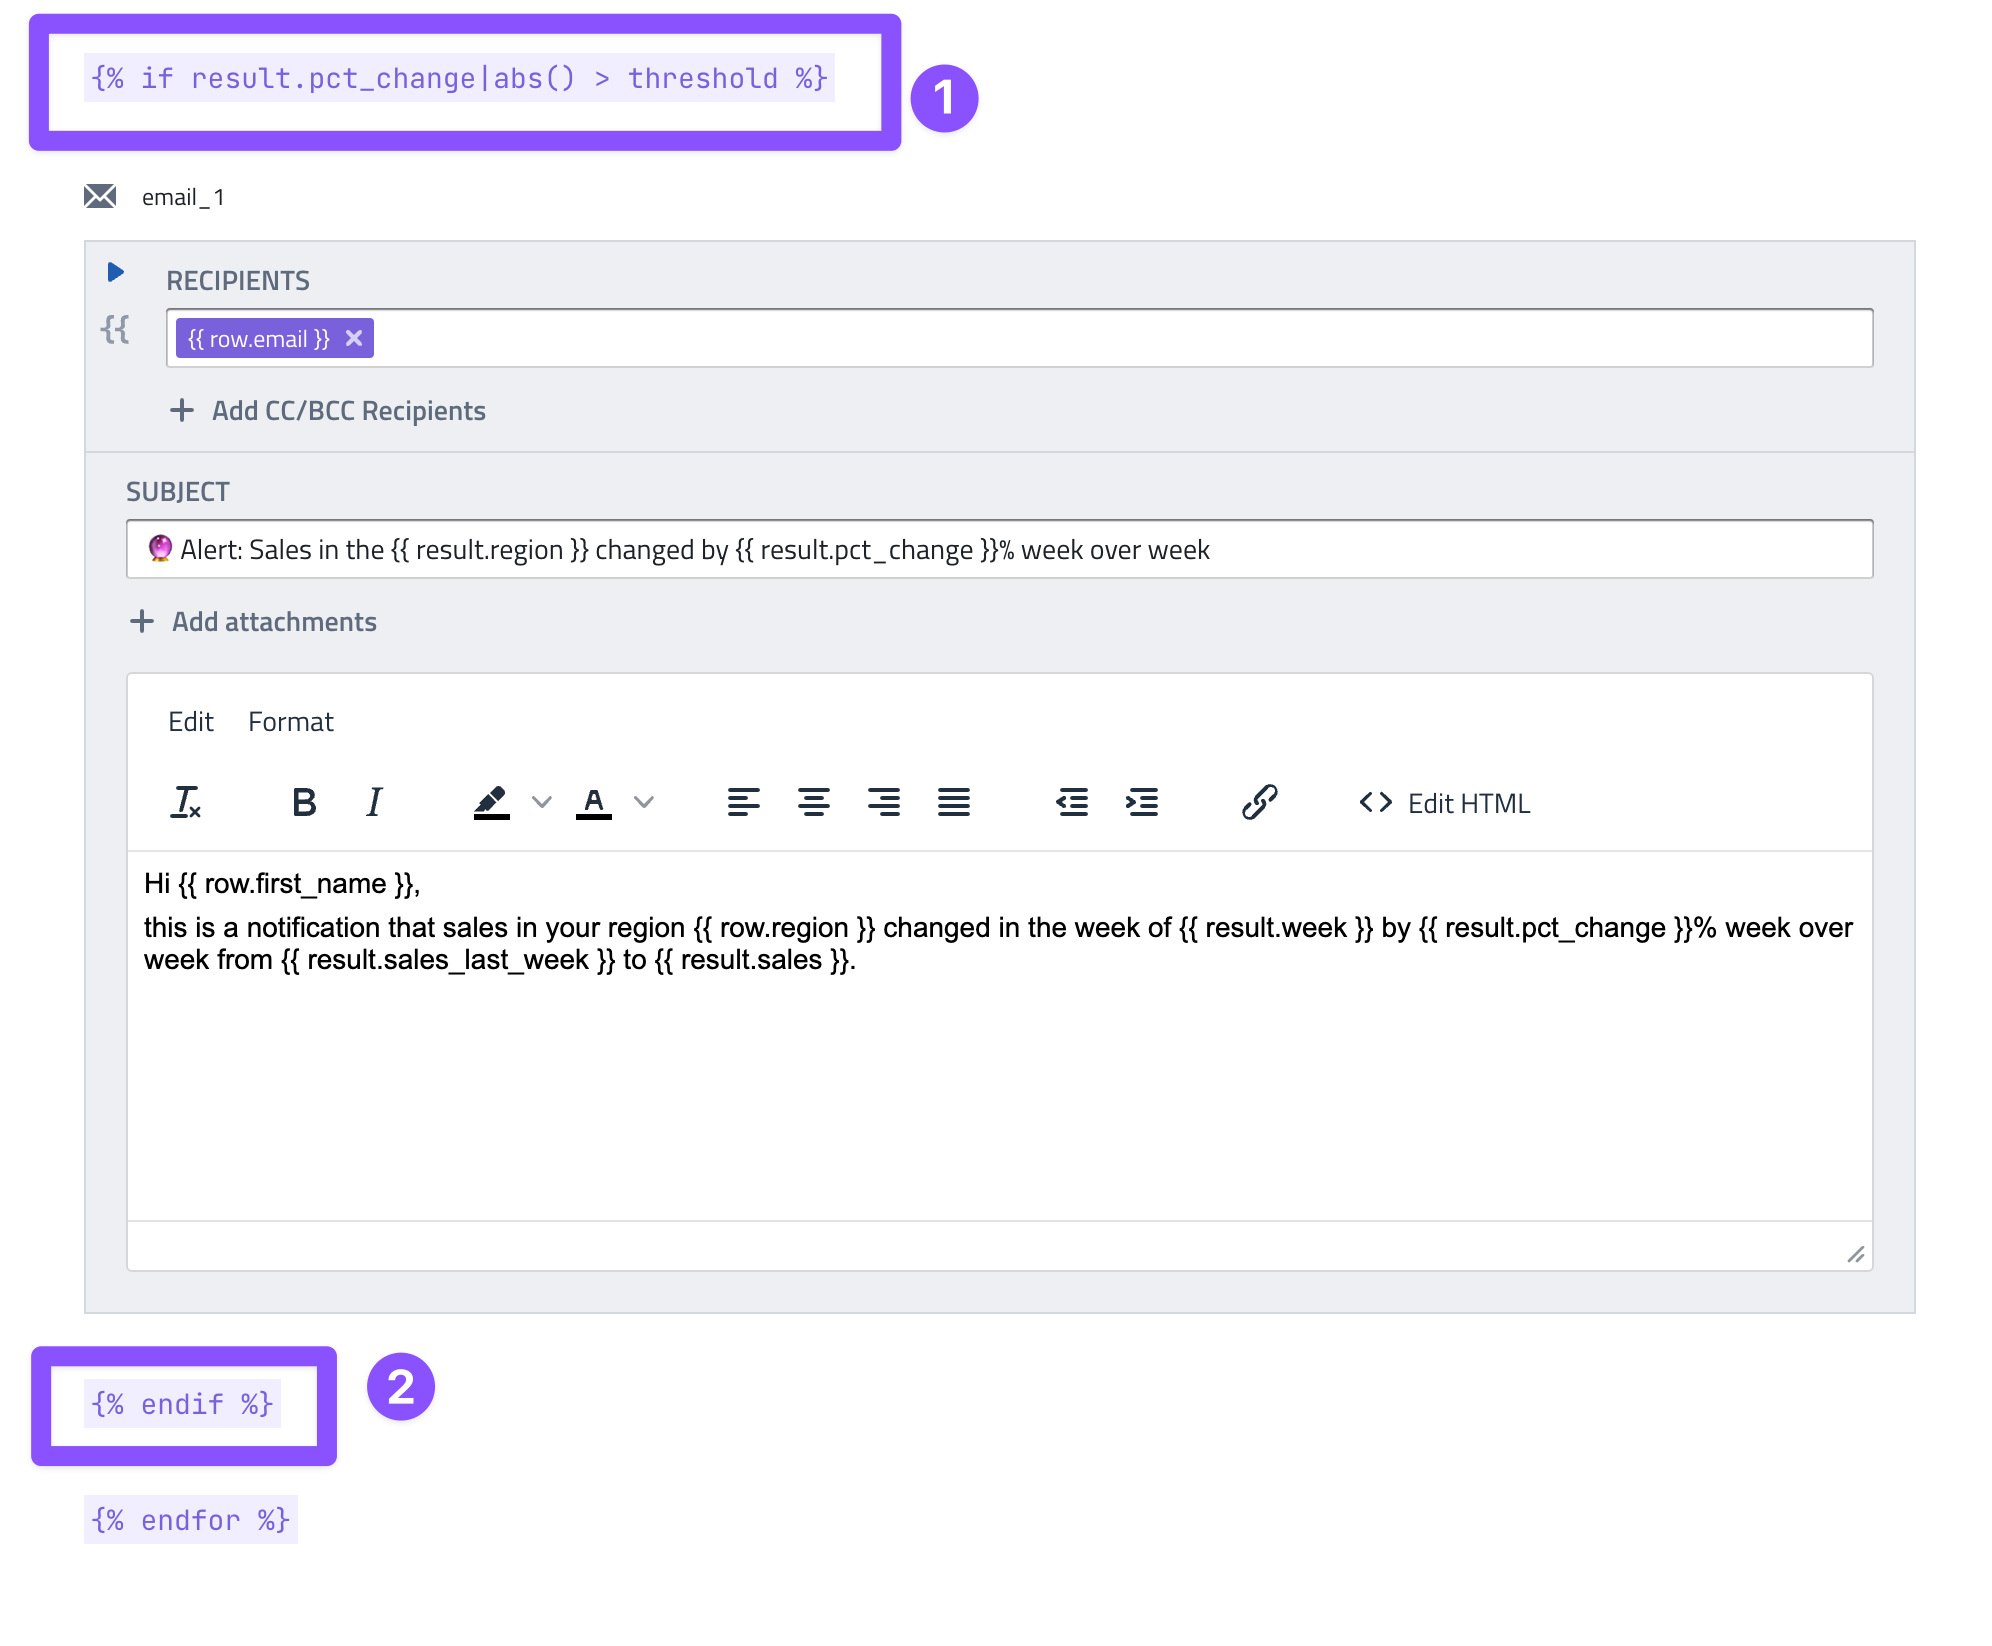
The alert rule is quite simple: {% if result.pct_change|abs() > threshold %}
- We access the
pct_changefrom our report query result. - We convert that number into an absolute value using the built-in filter
abs(), separated with a|(after all, we want the alert to trigger for both positive and negative changes) - We add a test using the parameter block from above
> threshold - Finally, we close the statement below the email block with
{% endif %}
So whenever the change in sales for a given recipient is greater than the parameter value (in our example 50%), the email message will be sent.
7. Testing & Scheduling
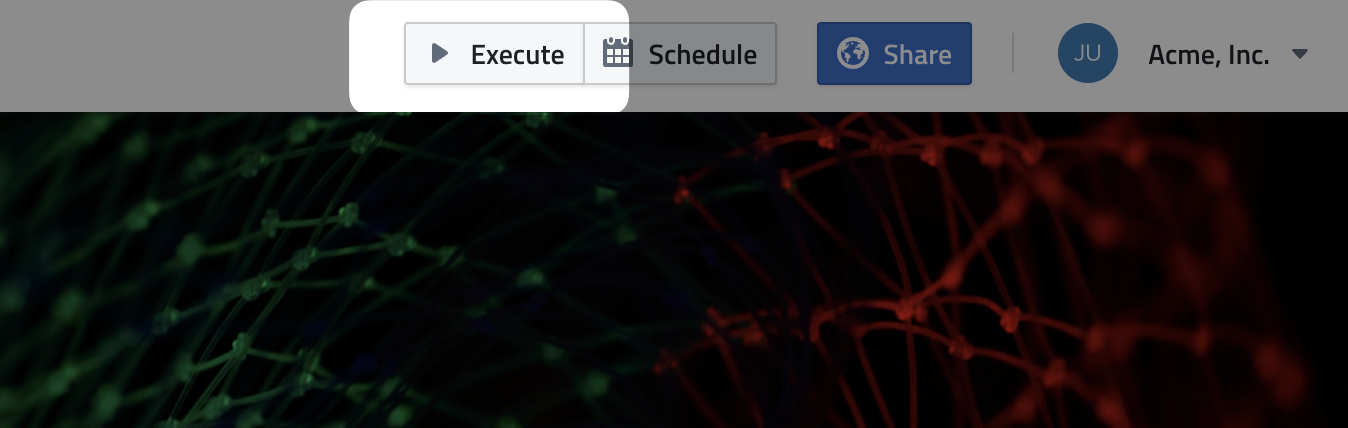
OK, it looks like we are almost done.
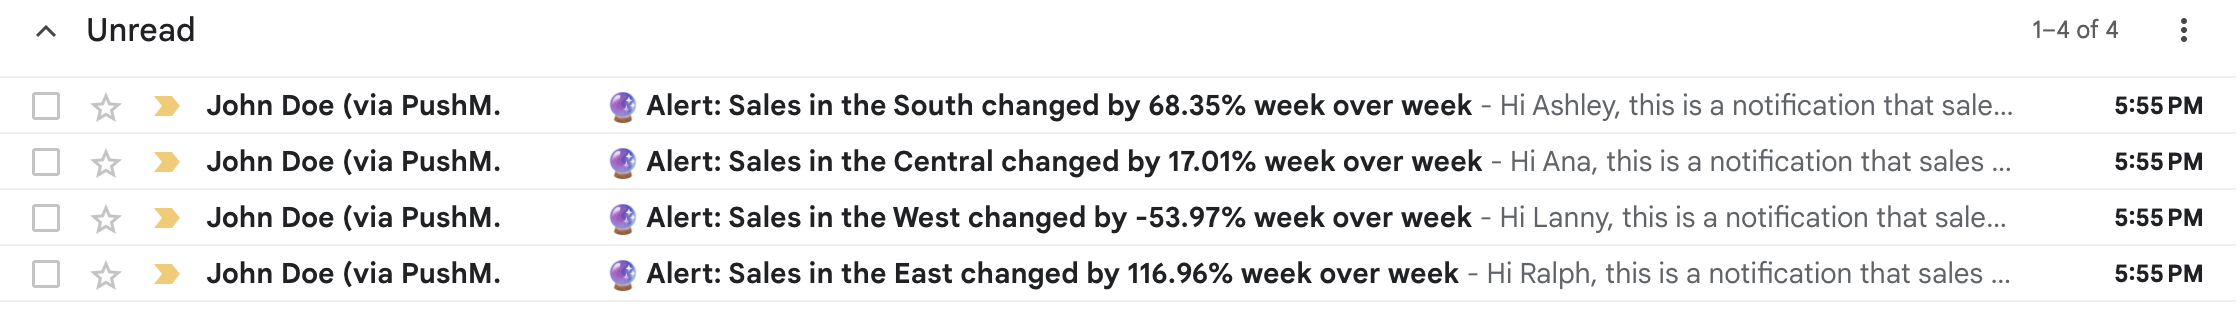
Let's give it a try and run the whole thing:
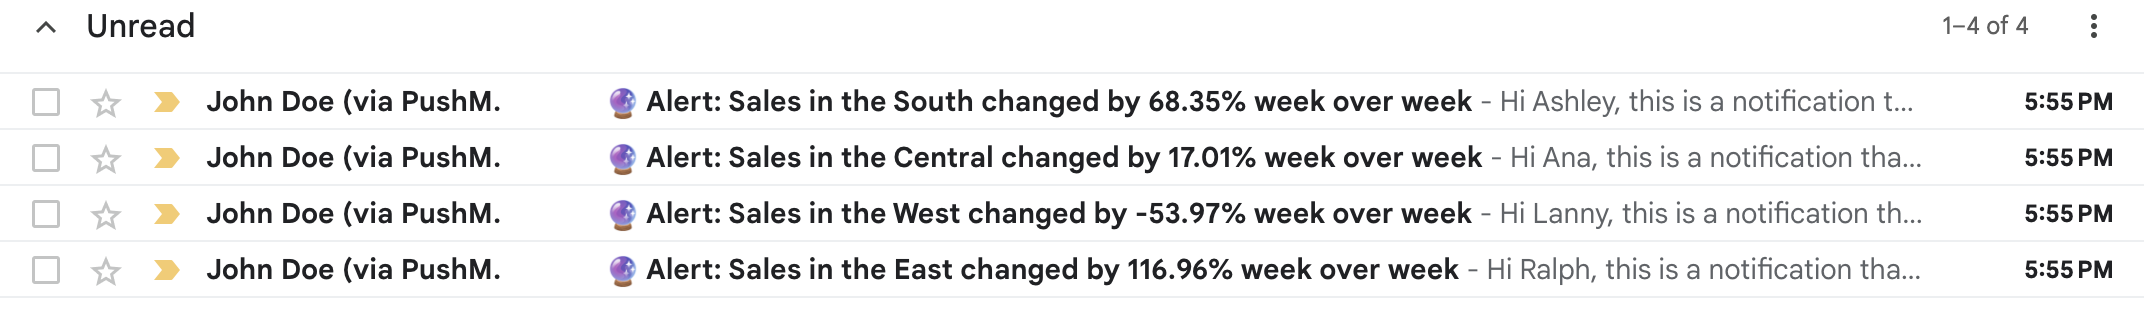
A few moments later, your inbox should look something like this:
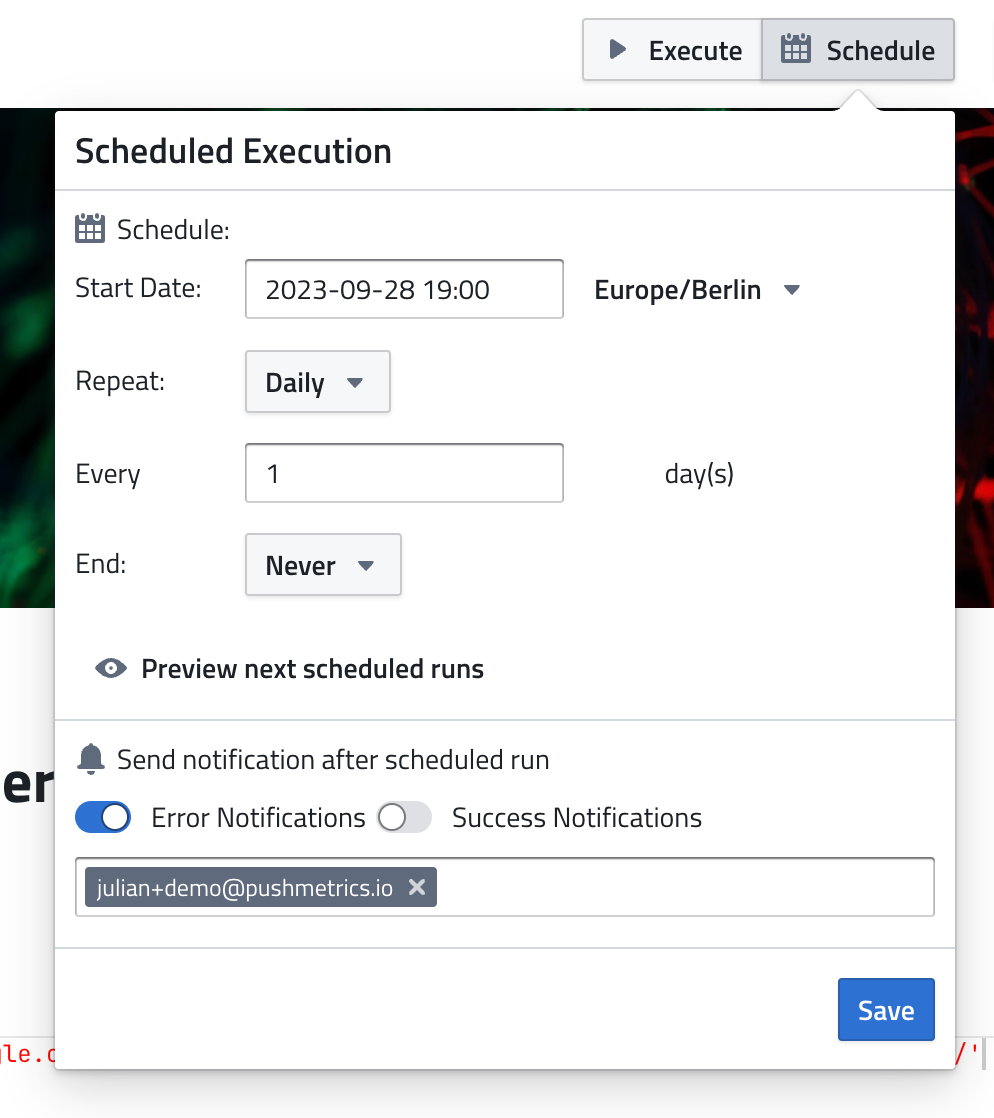
This brings us to our final point: Scheduling this to be run automatically.
That's all, folks
I hope this example was able to illustrate how you can build custom workflow logic in a PushMetrics notebook using a combination of:
- SQL blocks
- Email blocks
- Parameters
- For Loops
- If/Else statements
Combining all these different building blocks allows for complex, almost limitless possibilities.
To learn more, check out the other sections of the documentation and get started building.