The 7 Essential Skills Every Rookie Data Analyst Needs: No Fluff, Just Facts
Mastering the Basics for a Standout Start in Data Analytics

So, you're starting your journey as a data analyst, huh? That's like being handed the keys to a supercar when you've only driven a golf cart.
It's exhilarating, intimidating, and oh-so-satisfying once you get the hang of it.
But before you peel out, let's talk about the seven key skills you'll need to not just drive but steer like a pro.
Skill 1: SQL - The Swiss Army Knife of Data Retrieval
What is SQL?
Structured Query Language (SQL) is the standard language for interacting with relational databases. If you're chatting up a database, you're likely doing it in SQL.
Why It's Important in Business
SQL is the valet key to a company’s treasure vault of data. It provides quick and targeted access to customer records, financial data, or even inventory statuses. In the business context, time is money, and SQL saves tons of both.
Where Data Analysts Benefit or Struggle
Benefit: The beauty of SQL is its universality. Once you master it, you can use these skills in almost any data environment.
Struggle: The challenge often lies in query optimization. Writing a query that gets you the right data is step one; writing it so it runs efficiently is the part that often stumps rookies.
How to Get Started?
New to SQL and keen to get started? Check out our SQL for Beginners course to start from scratch (or to simply brush up your skills).
If you want to invest a bit more time and even go for a certification, try SQL courses on platforms like Codecademy or Coursera. Many of these are beginner-friendly and can get you writing queries in no time.
Quick Tip: Sure, SELECT * is easy, but it’s the SQL equivalent of fishing with dynamite. Learn to write targeted queries. Your database, and your sanity, will thank you.
Skill 2: Statistical Programming - Python or R, Take Your Pick
What is Statistical Programming?
Languages like Python and R are the heavy machinery of data analysis. They help you manipulate, analyze, and visualize data in ways that make spreadsheets look like child's play.
Why It's Important in Business
Both Python and R are invaluable tools for making sense of data and drawing insights that inform strategic decisions. Whether you're predicting customer behavior or forecasting sales, you'll be doing it through statistical programming.
Where Data Analysts Benefit or Struggle
Benefit: Learning Python or R opens doors to more advanced analytics methods and more comprehensive data manipulation techniques.
Struggle: The steep learning curve is the catch. While these languages are powerful, they require a significant investment of time and mental energy to master.
How to Get Started?
There is certainly no shortage of Python and R tutorials. To be honest, you can probably already spend a day just browsing relevant subreddits discussing which are the best tutorials in any given year.
To make it easy for you, here’s our take: Choose either Python or R and take an introductory course on platforms like DataCamp.
Once you're comfortable with the basics, dive into data manipulation libraries like Pandas for Python or dplyr for R.
Quick Trick: Start with Python for versatility or R for statistical depth. Either way, stick with it until you’re comfortable, and then consider cross-training.
Skill 3: Machine Learning - Not Just A Buzzword
What is Machine Learning?
Machine learning is a subset of artificial intelligence that enables computers to learn from data. It's like teaching your computer to fish so that you can have a lifetime of data-driven decisions.
Why It's Important in Business
Machine learning algorithms can detect patterns that are far too complex for a human to spot. Whether it's predictive analytics, customer segmentation, or fraud detection, machine learning offers innovative solutions.
Where Data Analysts Benefit or Struggle
Benefit: A basic understanding can set you apart from other analysts and add significant value to your team.
Struggle: It's easy to go down the complexity rabbit hole. Trying to implement an advanced algorithm when a simple one would suffice is a common pitfall.
How to Get Started?
If you are completely new to machine learning, remember to start with the basics and start slow. Start with an introduction to machine learning and test the waters with simple supervised learning algorithms. Websites like Kaggle offer competitions that can be a fun and practical way to hone your skills.
Quick Tip: Start small. Learn basic algorithms before tackling neural networks or ensemble methods.
Skill 4: Probability and Statistics - The Name of the Game
What is Probability and Statistics?
Probability and statistics are the mathematical backbone of data analysis. They're the scales that help you measure and interpret the weight of your data.
Why It's Important in Business
Making decisions based on gut feelings is so last century. Businesses now rely on statistical models for everything from marketing strategies to inventory management.
Where Data Analysts Benefit or Struggle
Benefit: A good grasp of statistics gives you a solid foundation for any type of data analysis.
Struggle: Misinterpreting p-values or confidence intervals can lead to faulty conclusions, potentially costing a business a lot.
How to Get Started?
Open online courses like those on Khan Academy or Coursera offer comprehensive introductions to probability and statistics.
And if you are looking for a more entertaining way of learning about statistics, here are some nuggets from our PushMetrics library:
- The Flaw of Averages: Why We Underestimate Risk in the Face of Uncertainty (here)
- How to Measure Anything: Finding the Value of Intangibles in Business (here)
- Statistics for the Rest of Us: Mastering the Art of Understanding Data Without Math Skills (here)
Quick Tip: Bookmark a reliable statistics reference site or keep a stats cheat sheet handy.
Skill 5: Data Management - More Than Just Cleaning Up
What is Data Management?
Data management involves storing, safeguarding, and ensuring the quality of data. Think of it as the hygiene factor; nobody notices when it's good, but everyone complains when it's bad.
Why It's Important in Business
Bad data equals bad decisions. Effective data management ensures that the data you analyze is accurate, consistent, and secure.
Where Data Analysts Benefit or Struggle
Benefit: Proper data management makes every subsequent step in data analysis faster and more accurate.
Struggle: Data cleansing can be incredibly time-consuming, and it's often undervalued until something goes wrong.
How to Get Started?
Cover the basics. Read up on data management fundamentals (think: data lifecycle management) and go on from there. Once you have covered the basic terminology, you should think “data management” at all times, start relevant discussions with your stakeholders (in your team and beyond), and try to apply your knowledge even further.
Learn the basics of data preprocessing with libraries like Pandas for Python (assuming you picked Python from above). Online tutorials can guide you through tasks like handling missing data and removing duplicates.
Quick Trick: Get familiar with data cleaning tools. They're like the vacuum cleaners of data management: not glamorous, but essential.
Skill 6: Data Visualization - A Picture is Worth A Thousand Data Points
What is Data Visualization?
Data visualization is the art and science of presenting data in graphical form. It's the difference between handing someone a spreadsheet and showing them a well-crafted chart.
Why It's Important in Business
Visuals can convey complex information in a way that is easily digestible, speeding up decision-making and making presentations more impactful.
Where Data Analysts Benefit or Struggle
Benefit: Good visualizations make your analyses accessible to people without a technical background.
Struggle: It's tempting to make overly complex visuals. The trick is to keep them simple enough to be understood while retaining the nuances of the data.
How to Get Started?
If you know nothing about this topic, you should get a copy of Storytelling with Data. It’s an eye-opening read for many folks in the data field. You’ll change the way you think about presenting your data.
Next, we would recommend to hone your skills in the most relevant data visualization solution that you are dealing with. There is no point in learning about Tableau if your company is fully immersed in Power BI. No matter which solution is used, become great at it!
Quick Tip: Learn to use visualization tools like Tableau or Power BI. These platforms offer a myriad of ways to show off your data.
Skill 7: Econometrics - The Fine Wine of Data Analysis
What is Econometrics?
Econometrics combines economics, mathematics, and statistical methods to analyze and interpret economic data. Think of it as the microscope that lets you examine the DNA of your data.
Why It's Important in Business
Econometrics can offer invaluable insights into market trends, customer behavior, and other key business metrics.
Where Data Analysts Benefit or Struggle
Benefit: With econometrics, you can design models that capture the true complexity of business operations.
Struggle: The flip side is that econometrics can be mathematically demanding, and errors in model specification can lead to incorrect conclusions.
How to Get Started?
Start with simple linear regression models. You can even play around with these in good old Excel.
If you want to go deeper, then go for a proper course. Websites like Coursera offer courses that delve into the basics of econometrics.
Quick Tip: Start simple. Don't jump into multivariate models without a solid understanding of simpler techniques.
Conclusion
And there you have it—the seven killer skills to be an effective data analyst in the modern business world (at least in 2023).
Each skill is a different tool in your analyst toolbox. Master these, and you'll be the go-to problem solver in any data-driven organization.
Now, stop scrolling and start skilling. Dive into that dataset like it's a pool on a hot summer day (that’s our way of saying that we miss those now that autumn is in full swing in our neck of the woods).
You've got the map; now go find that treasure.
Julian Schulte
Related Articles
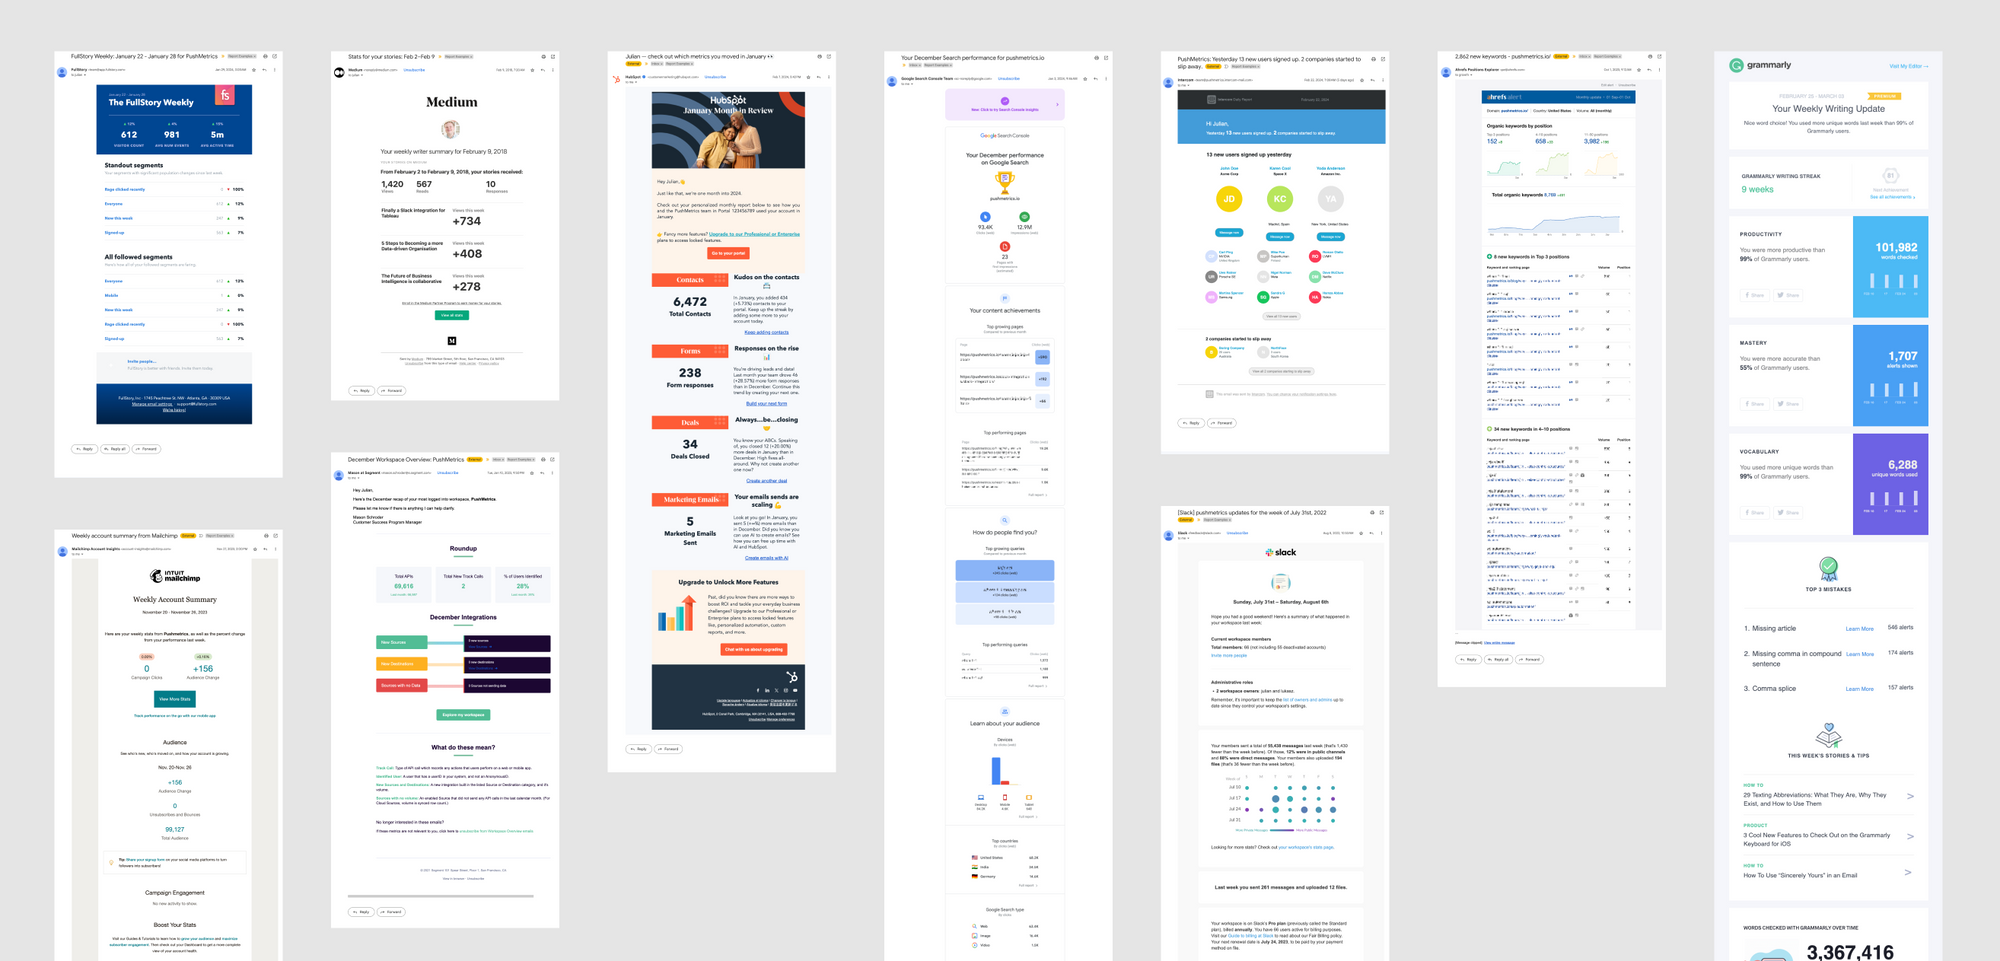
10 SaaS Usage Report Emails: How Companies Like Hubspot, Slack & Intercom Use Data To Maximize User Engagement
Product usage report emails are more than just automated messages; they're a window into how users interact with software, providing invaluable insights on engagement levels, feature adoption, and areas for improvement.

Julian Schulte
10 SaaS Usage Report Emails: How Companies Like Hubspot, Slack & Intercom Use Data To Maximize User Engagement
Product usage report emails are more than just automated messages; they're a window into how users interact with software, providing invaluable insights on engagement levels, feature adoption, and areas for improvement.
Julian Schulte
Subscribe to our newsletter
Get the latest updates from the PushMetrics team.
Thank you for subscribing.
Start sending data-driven messages today
Sign up and start using PushMetrics for free.
Or schedule a demo and discuss your use case.