“SQL Mail Merge” is THE productivity hack that you’ve been waiting for as a data analyst 💪
How to deliver personalized reports & relevant alerts to everyone — without the manual work
Imagine you’re tasked with delivering a new report for your account management team. Soon you realize that there are many different use cases, many different breakdowns, and many different stakeholders to
consider.
How do you pull that off?
“Easy,” you say. “I just create one gigantic excel spreadsheet with ALL the numbers and send it to everyone, every day.”
Sure, great idea…but…don’t we live in the age of “self-service BI”?
“Well, ok. Then I’ll just create a dashboard with a big table and one line chart and add 20 different filter options and put the link to the dashboard to the company wiki. Done.”
That’s the spirit! Of course you know that this won’t do the trick. But let’s be honest — this is what happens way too often.
Instead, reporting has to be timely and relevant. Otherwise nobody will even open your report, no matter how much effort you have put into it.
In the end, Business Intelligence can only live up to its expectations if it delivers the right message, to the right audience, at the right time.
“Sure, ...but how do you pull THAT off?” you say.
Yet another mail merge? 📬
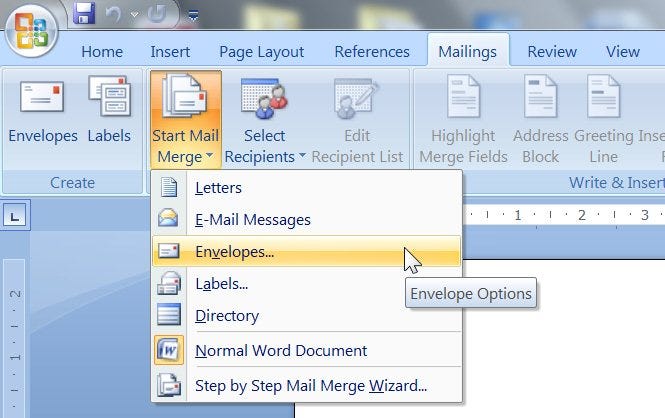
You might know the term “mail merge” from applications like Microsoft Word that allows you to specify one template and then replace names, addresses and other elements of the letter with data from an Excel spreadsheet. This way, you create one letter and get hundreds of different results, personalised for the individual recipient. It’s the same concept marketing tools like Mailchimp, Intercom, etc. use to create targeted and personalised email campaigns.
While this concept isn’t new at all —it’s been around since the 80s — so far, we’ve not seen it implemented well in Business Intelligence use cases.
Or put differently:
Why is there no easy way to create transactional messages using simple SQL statements?
This is what we asked ourselves. And then we just built it. And the result is more powerful than we had imagined.
Hello “Mail Merge Reports”. 👋
“Mail Merge Reports” are a new, extremely powerful feature in our app PushMetrics that allows you to build scalable reporting and alerting workflows that send personalized messages to audiences of any size, while only maintaining one report template.
This is very useful if you want to:
- send charts or dashboards to multiple people with different filters applied for each person,
- monitor KPIs across many different dimensional breakdowns and then send alerts to the right audience,
- send reports only if certain data conditions are met,
- send transactional emails or Slack messages with values from a SQL query injected to the message.
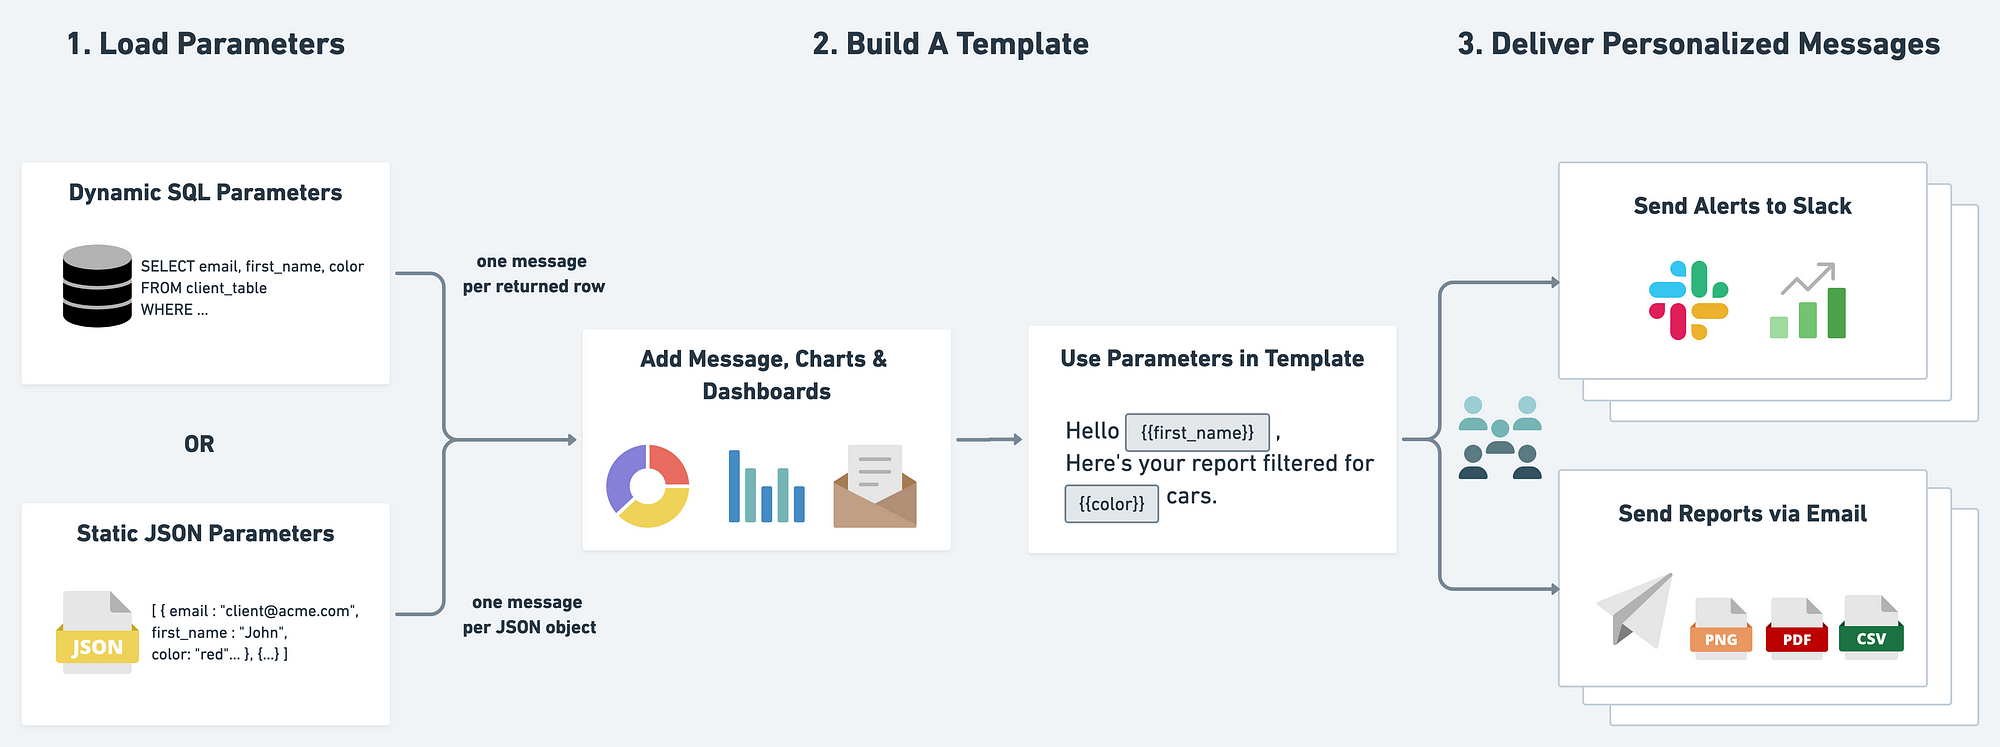
Essentially, you can combine a list of parameters (such as email addresses, names, regions, KPIs, etc.) with a report template (containing message, recipients, charts, dashboards, CSV exports, etc.).
The list of parameters can be provided via a static JSON array, or it can be loaded dynamically via a SQL query.
For each JSON object or for each row returned by the SQL query, one message is being sent.
It’s really the SQL query that makes it truly powerful.
For each row returned by the SQL query, one message is being generated.
Let that sink in for a moment. This means you can control the execution flow of a report distribution via SQL.
This has a few powerful implications:
- You can pull a distribution list dynamically — at runtime — from your database.
Client email changed? New colleagues? Accounts got reassigned? — You don’t need to touch your reports. As soon as the latest CRM data hits your warehouse, the report will have an up to date distribution list. - If no rows are returned, nothing is sent.
Simply embed data quality checks before you send out reports. For example, check if the data warehouse has all the most recent data. - Only returned rows produce a message
Turning a normal report into an alert rule is now just adding aWHEREorHAVINGclause to the query. This way you can implement any alerting logic that can be put into a SQL statement. - Parameters can serve as meta data to filter charts & dashboards
You can pull filter values via SQL and then apply them to your existing charts, tables & dashboards to send out personalized data visualizations — for example to automate customer reporting. - The message can be tweaked depending on the data
You can bring in conditional formatting and even change entire sentences depending on KPI values. This can deliver a much higher degree of personalization and relevance than “Hi{{first_name}}!”. You can do this by usingCASEstatements in the query or{% if %}functions in the message template.
Putting it all together
Alright, let’s go through an example to illustrate the concept. We’ll create a reporting workflow that sends a weekly report to a set of imaginary customers via email.
1) Loading Parameters
In PushMetrics, we create a new workflow and select “Parameterized Execution (Mail Merge)” :
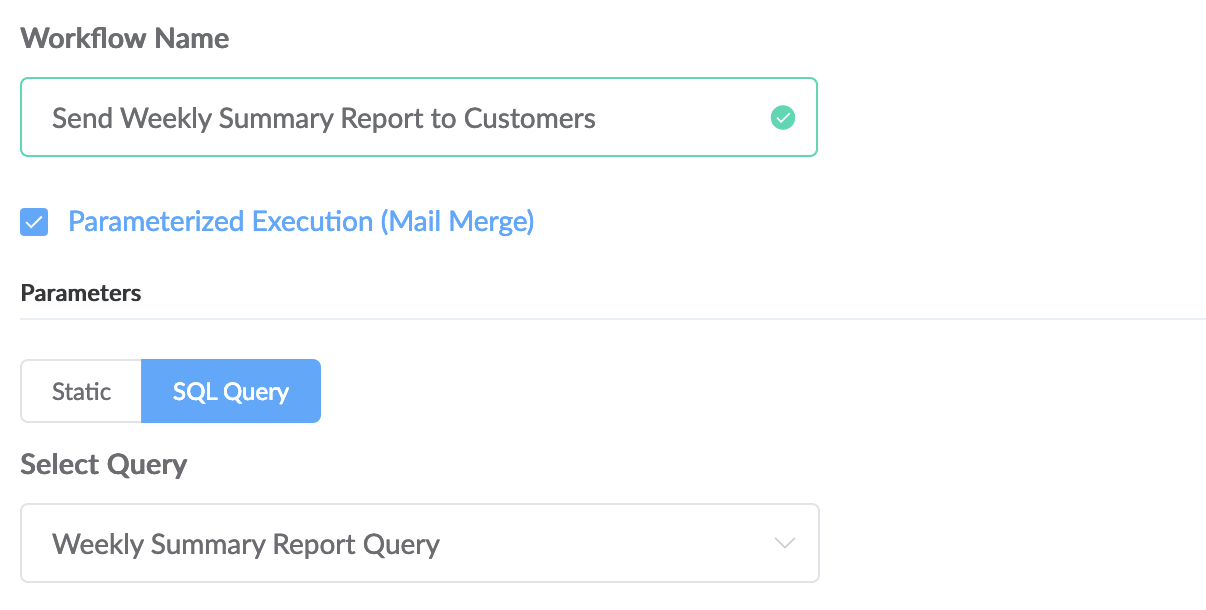
Once this option is enabled we can load parameters (in contrast to a “simple report” that would just take hardcoded values as input).
We can now choose between static JSON values or a SQL query.
Here’s a simple example for JSON parameters:[
{
"first_name": "John",
"last_name": "Doe",
"email_recipients": "john.doe@pushmetrics.io",
"slack_recipients": "John Doe (U4FPP5UU8)",
"filtername": "Region",
"filtervalue": "Asia"
},
{
"first_name": "Dave",
"last_name": "Moe",
"email_recipients": "dave.moe@pushmetrics.io",
"slack_recipients": "general (C4FPP5UU8)",
"filtername": "Region",
"filtervalue": "North America"
}
]
Using this, we can generate two iterations of the report, one for each JSON object. John would get a report filtered for Region=Asia sent to his email and a personal Slack message while Dave get’s an email and a message to the #general channel in Slack filtered for Region=North America.
This makes a lot of sense if you have values that never or rarely change and you simply want to loop through a set of parameters.
However, in our example we will pull parameters from our database directly.
The SQL query could look like this:SELECT
email,
customer_id,
first_name,
last_name,
1- SUM(orders_current_week)/SUM(orders_prev_week) as order_growth
FROM customer_weekly_summary
GROUP BY 1,2,3,4
This will return a list of customers with some contact details and their order growth compared to the previous week.
Notice how we could easily make this conditional and turn it into an alert by simply adding a clause like HAVING SUM(orders_current_week) = 0; to only send a message to customers with no orders (or their account managers).
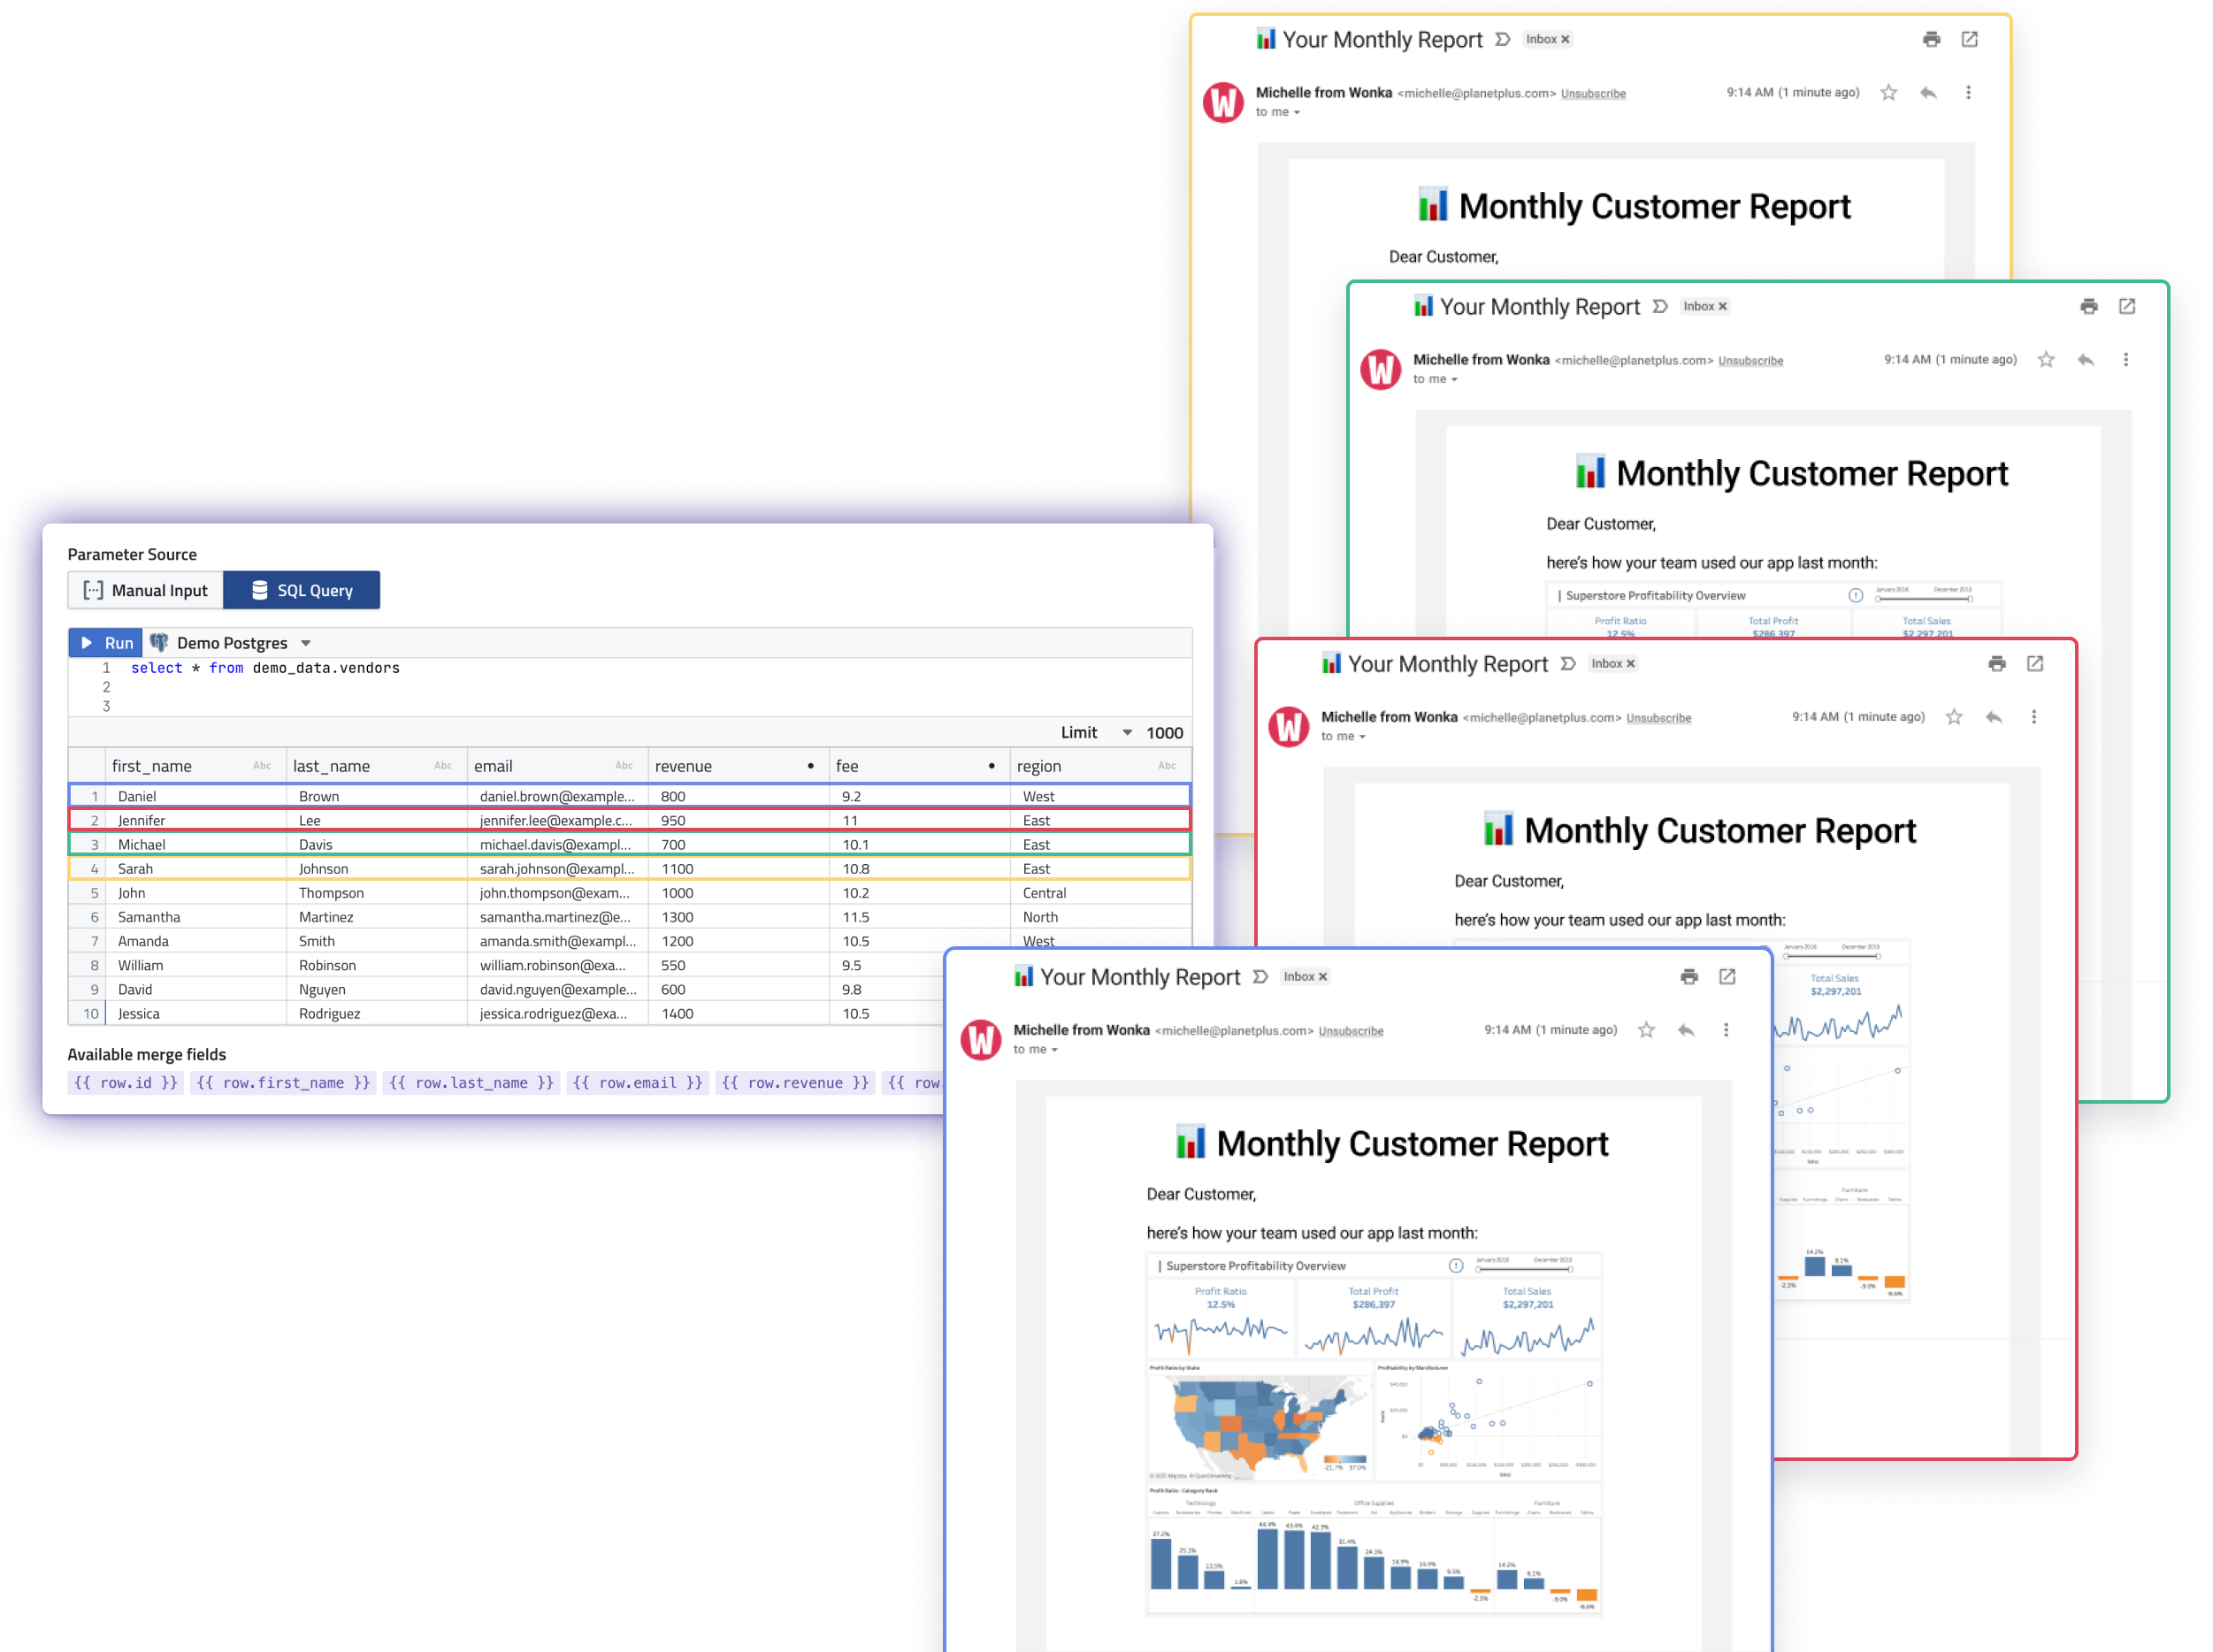
2) Building the template
In the next step, we will build the report template and use the variables all across the report to customize:
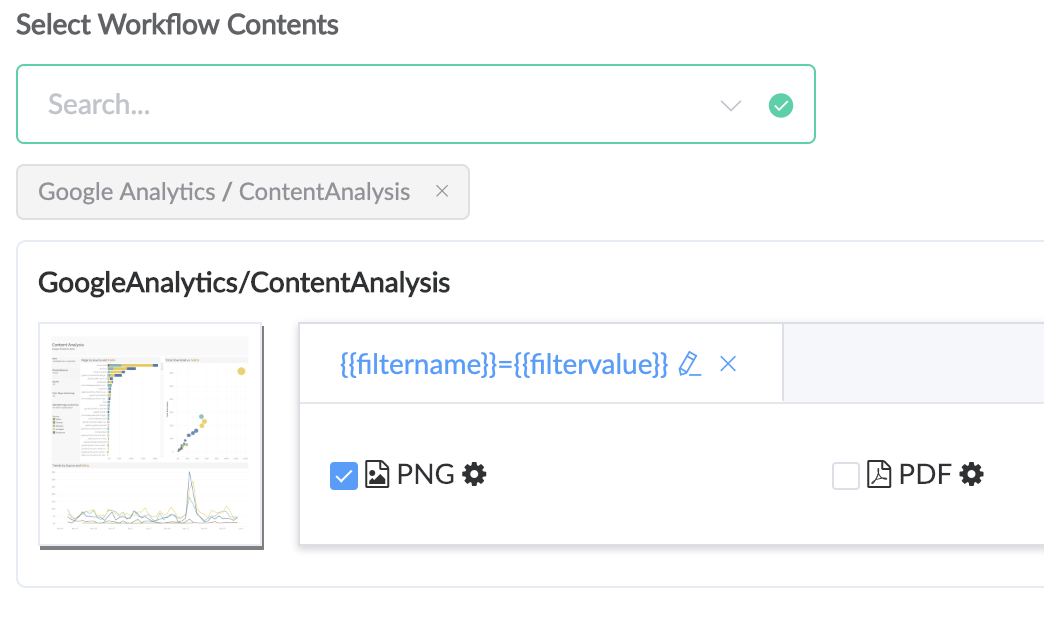
- attachments,
- recipients,
- file names,
- subject line,
- email body,
- etc.
Notice that you can add many different charts & dashboards to the template and specify their output format (Images, PDFs, CSVs, XLSX).
We even allow you to merge multiple CSV files into one Excel workbook or merge PDFs into a multi-page PDF.
So in a way, we help you generate that massive excel spreadsheet after all. Because we know you want it. ¯\_(ツ)_/¯
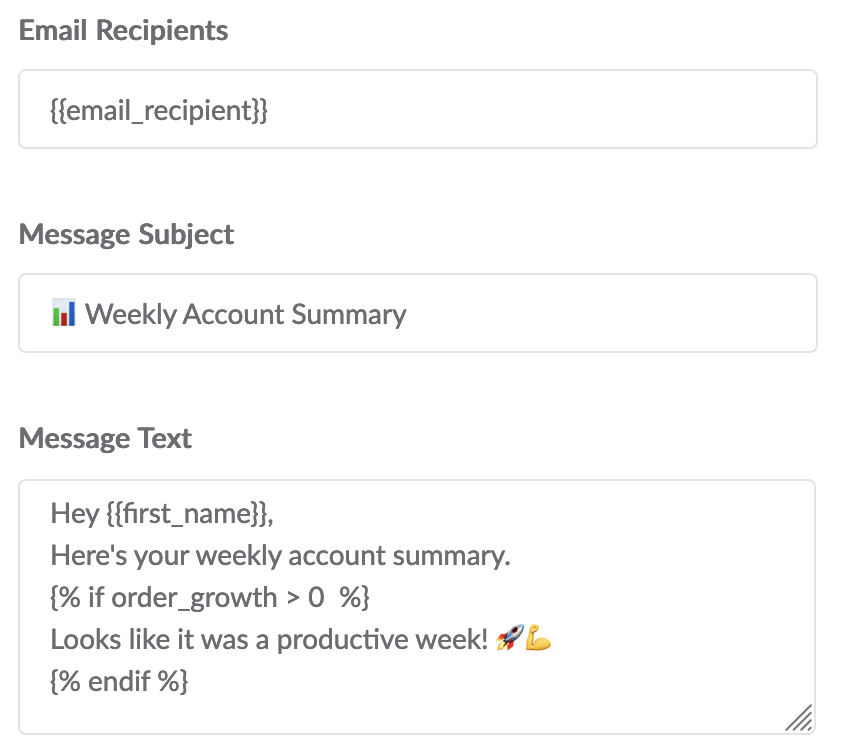
We are using JINJA templating syntax for the template, i.e. we wrap the column names of the query result in double curly brackets —e.g. {{ email }}, which will then be replaced with the values returned by the query — one row at a time.
JINJA gives us even more powerful options such as IF statements, LOOPS , or some pre-configured functions, e.g. {{ ds | date_substract(1)}} returns yesterday’s date.
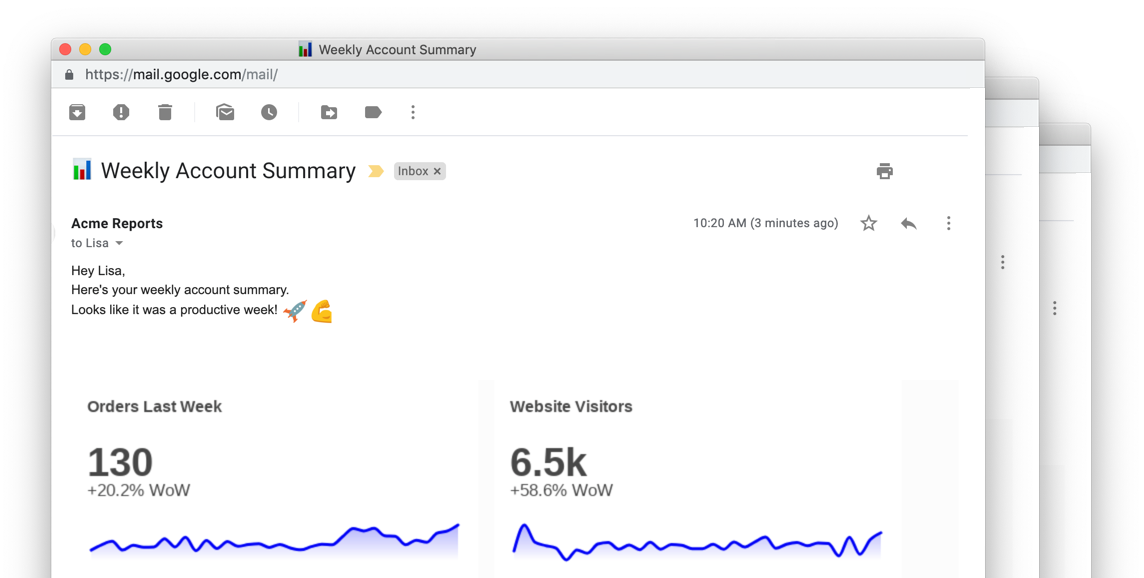
Here’s an example message:
3) Delivering Personalized Messages
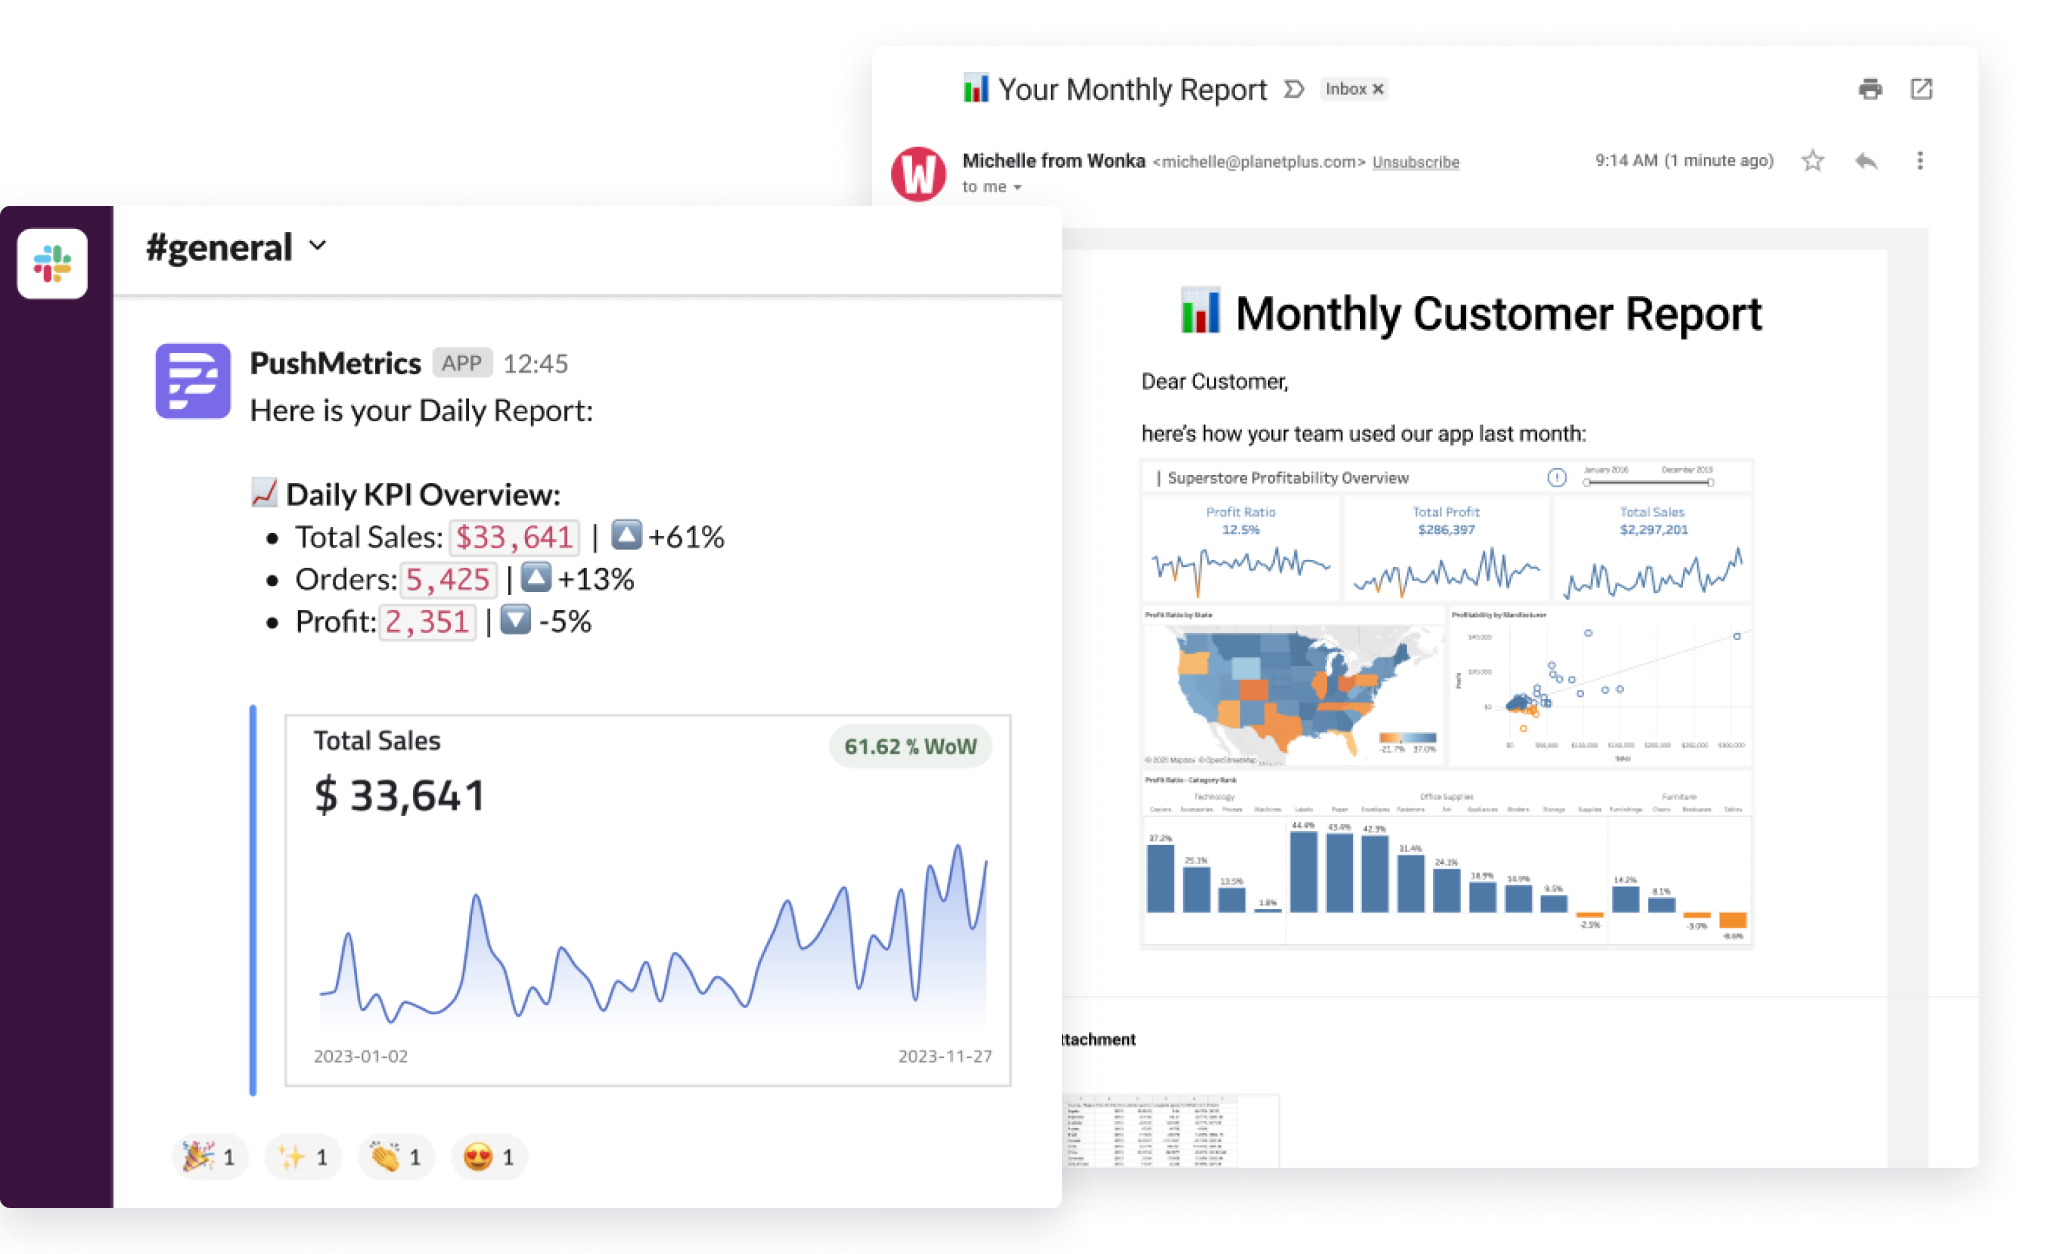
Workflows can be run on a set schedule, triggered by a webhook or run manually. In any case, the final result will then look like this:
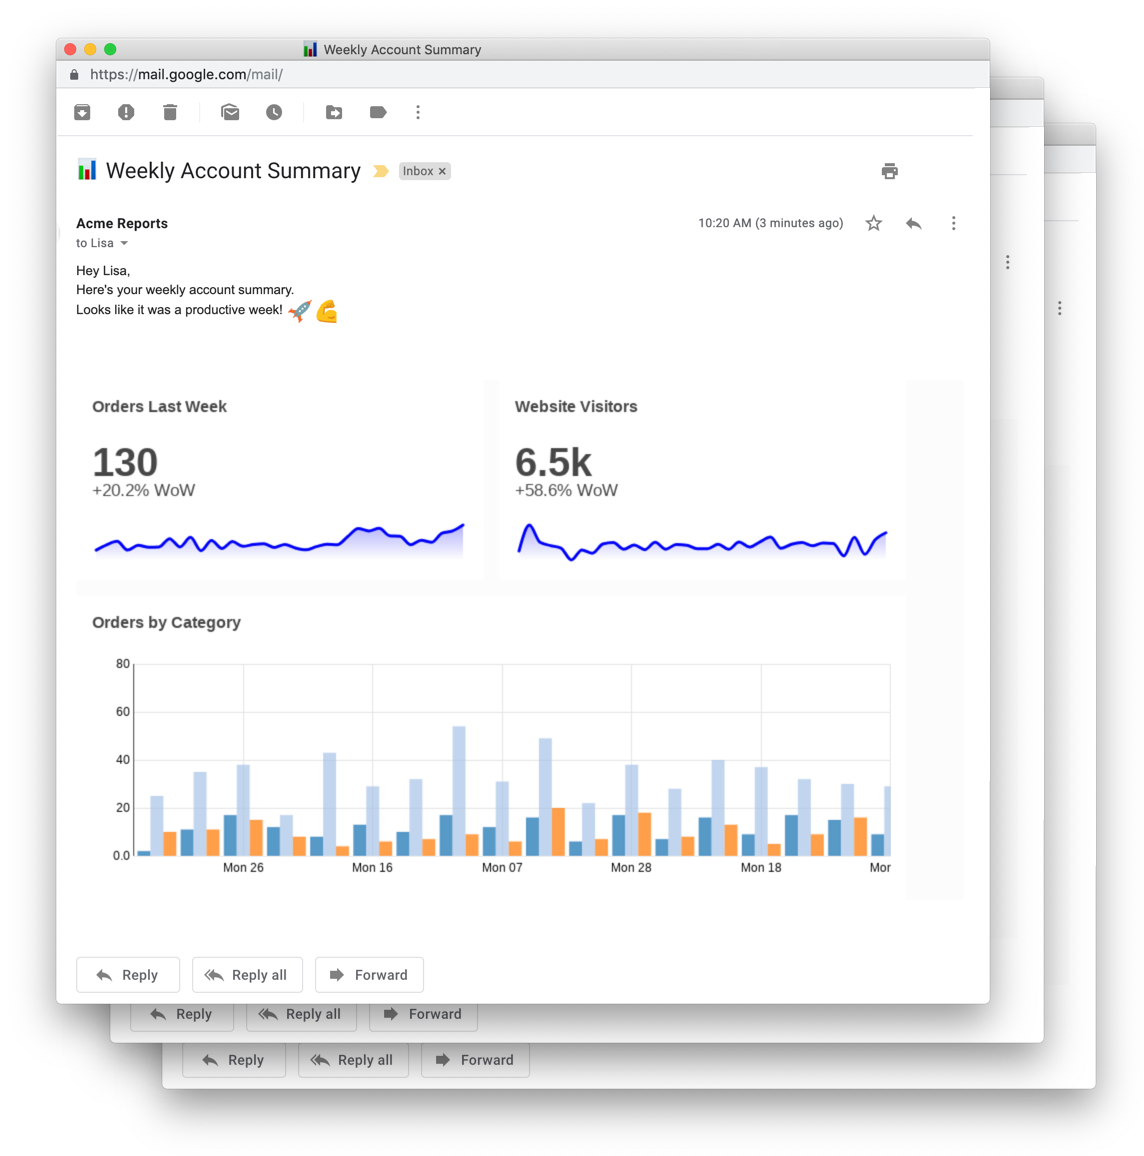
One email will be sent to every customer returned by the query. Every email is personalized and will contain a dashboard filtered by CustomerID, and a motivating message that is only shown if order growth developed in a positive way.
Making it a bit more colourful in Slack
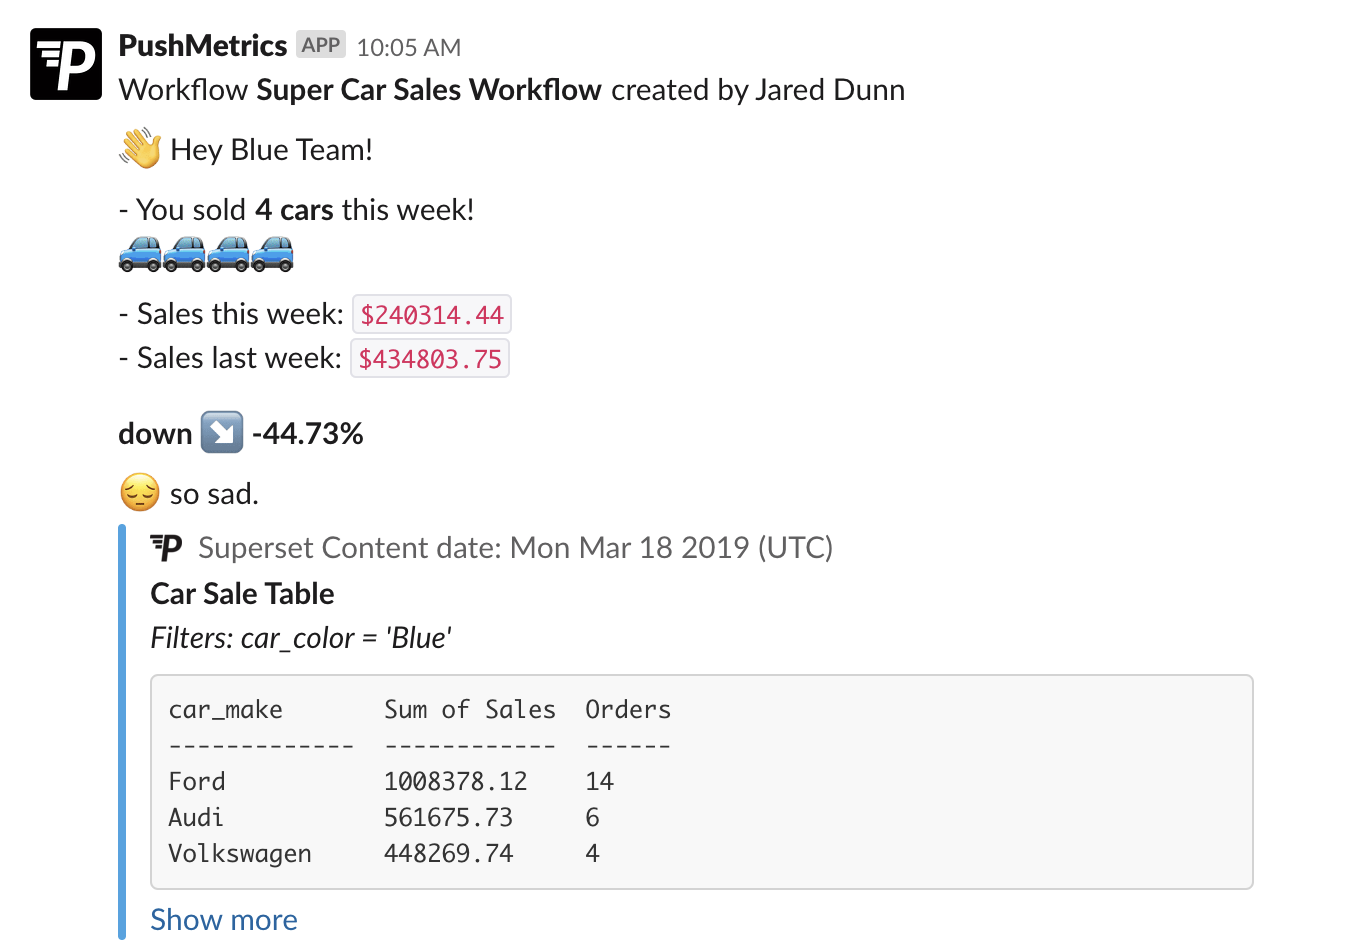
Here’s a different example for an internal Slack distribution case:
Sales Team A get’s this delivered to their Slack channel:
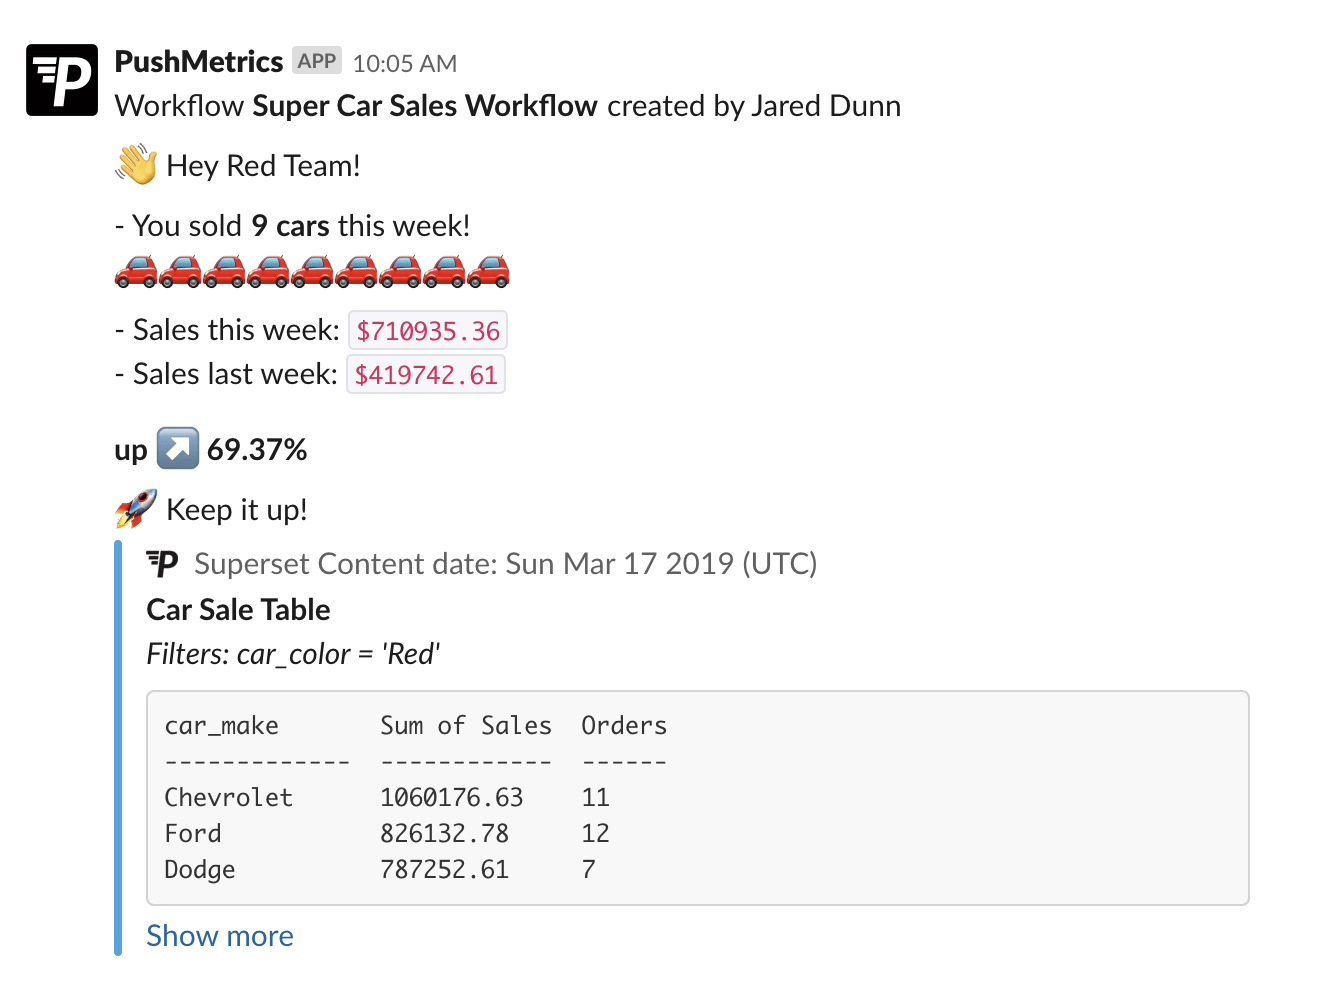
And Sales Team B gets:
And this is just scratching on the surface of all the possibilities.
We can’t wait to see what you’ll be building.
Conclusion
“SQL Mail Merge” is a powerful concept that allows you to create scalable reporting and alerting workflows —for both internal and external stakeholders.
It can help you make reports more personal and more relevant. It empowers you to create distribution and alerting logic by leveraging the power of SQL and your database and combining it with the flexibility of modern email marketing tools.
If you think this is interesting, give it a try and sign up for a free trial of PushMetrics. And be sure to send us your feedback.
Kenneth Roos
Related Articles
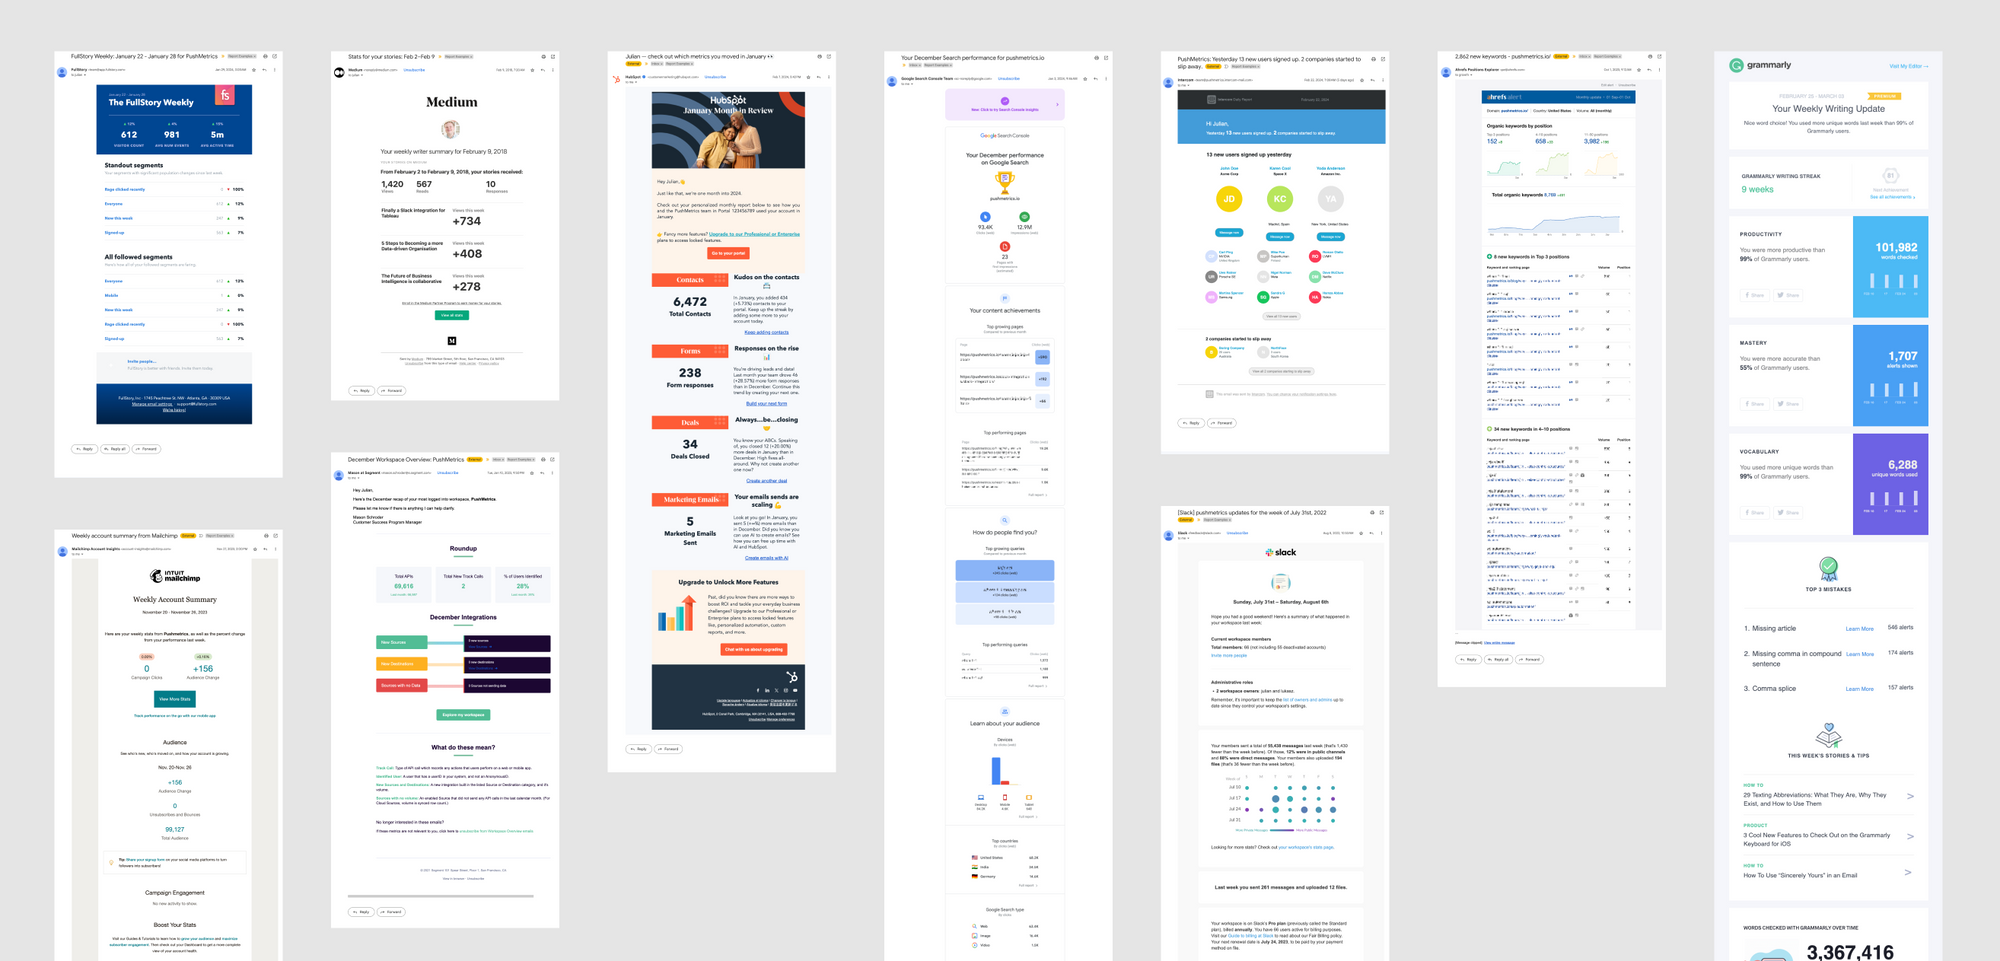
10 SaaS Usage Report Emails: How Companies Like Hubspot, Slack & Intercom Use Data To Maximize User Engagement
Product usage report emails are more than just automated messages; they're a window into how users interact with software, providing invaluable insights on engagement levels, feature adoption, and areas for improvement.

Julian Schulte
10 SaaS Usage Report Emails: How Companies Like Hubspot, Slack & Intercom Use Data To Maximize User Engagement
Product usage report emails are more than just automated messages; they're a window into how users interact with software, providing invaluable insights on engagement levels, feature adoption, and areas for improvement.
Julian Schulte
Subscribe to our newsletter
Get the latest updates from the PushMetrics team.
Thank you for subscribing.
Start sending data-driven messages today
Sign up and start using PushMetrics for free.
Or schedule a demo and discuss your use case.