Scaling Up Your Tableau Reporting Workflows
Tips and Tricks to Deliver Insights to Your Audience at Scale
Report bursting isn’t a one-size fits all, but rather an intelligent way to distribute relevant data to the right people when they need it.
Here are some tips for generating Tableau burst reports by utilizing PushMetrics within your reporting workflows.

Reducing Report Overload & Organizational Chaos
Using Filters & Multiple Data Formats
As organizations grow, a collection of reports can easily become unmanageable without a proper centralized system of maintaining that information. This can lead to several versions of the truth, confusion, and conflict within a company; not to mention more difficult to properly manage and maintain.
However, reducing the number of reports can be easily done by just filtering the same Tableau view or dashboard in the PushMetrics app multiple times when creating a report. This provides drill down functionality to be able to see the business in more detail, but without adding more complexity and more dashboards.
Have you ever seen your company’s overall monthly performance report? They usually contain loads of information that may be extensive, but not necessarily relevant for everyone.
This causes many people to become numb to information overload thus encouraging them to ignore it, and ignoring important information is akin to ignorance.
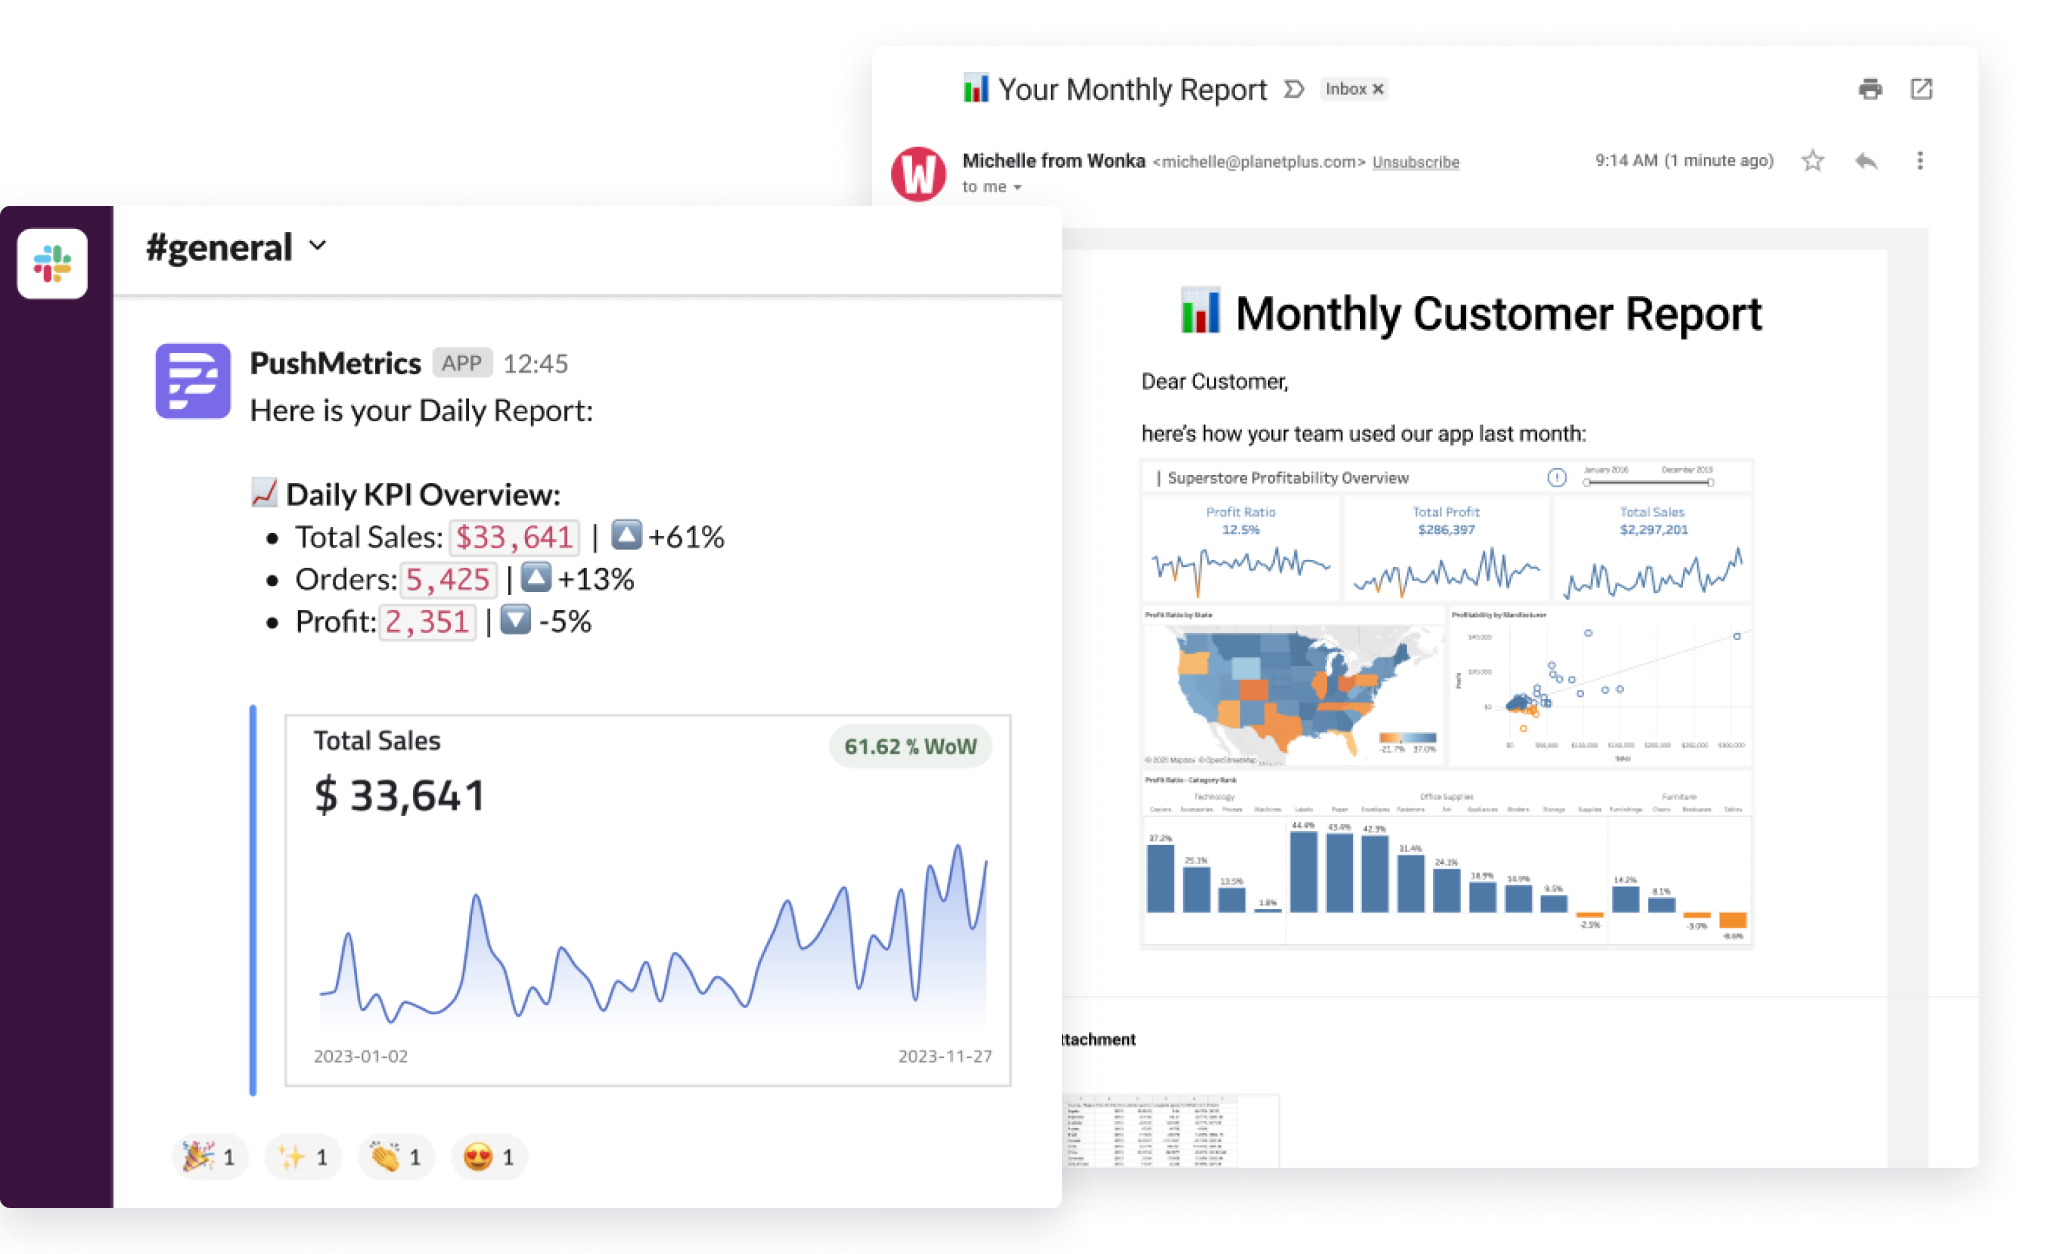
Using filters and options for formatting data give ultimate control to create an interesting overview, but without overwhelming an entire audience in the process. PushMetrics makes it easy to repurpose and combine the most important views even from different Tableau dashboards into one report.
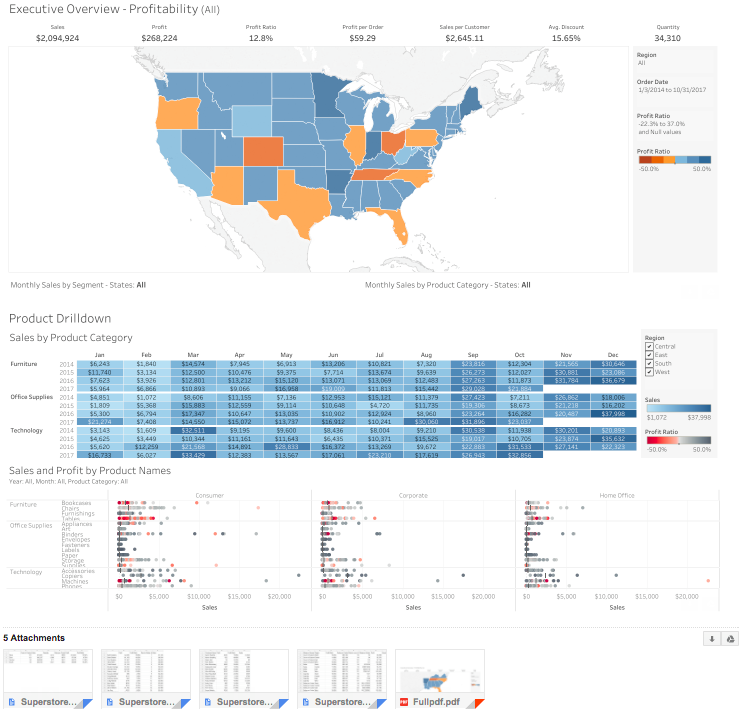
In the example above, the entire overview of products and customers are shown along with CSV outputs that break down products and customers per region. The same information can also be more easily viewed as visualizations in a single, multi-page PDF summary.
Customizing Standard Reports
Filter Loops & Merging Data
Suppose we want to create a revenue report to send to sales managers or to a set of external clients who don’t have central access to the data or — let’s face it — will simply not log in to your self-service portal. These are two very distinct report bursting use cases that can be easily achieved using the same PushMetrics functionality; a combination of using Tableau view filters and the ability to merge the data later when needed.
In this example, we’d like to inform clients of their performance. In addition, the sales manager would like to explore a promotional sales opportunity based on client performance, and would thus need a high level overview, but with access to more detailed data.
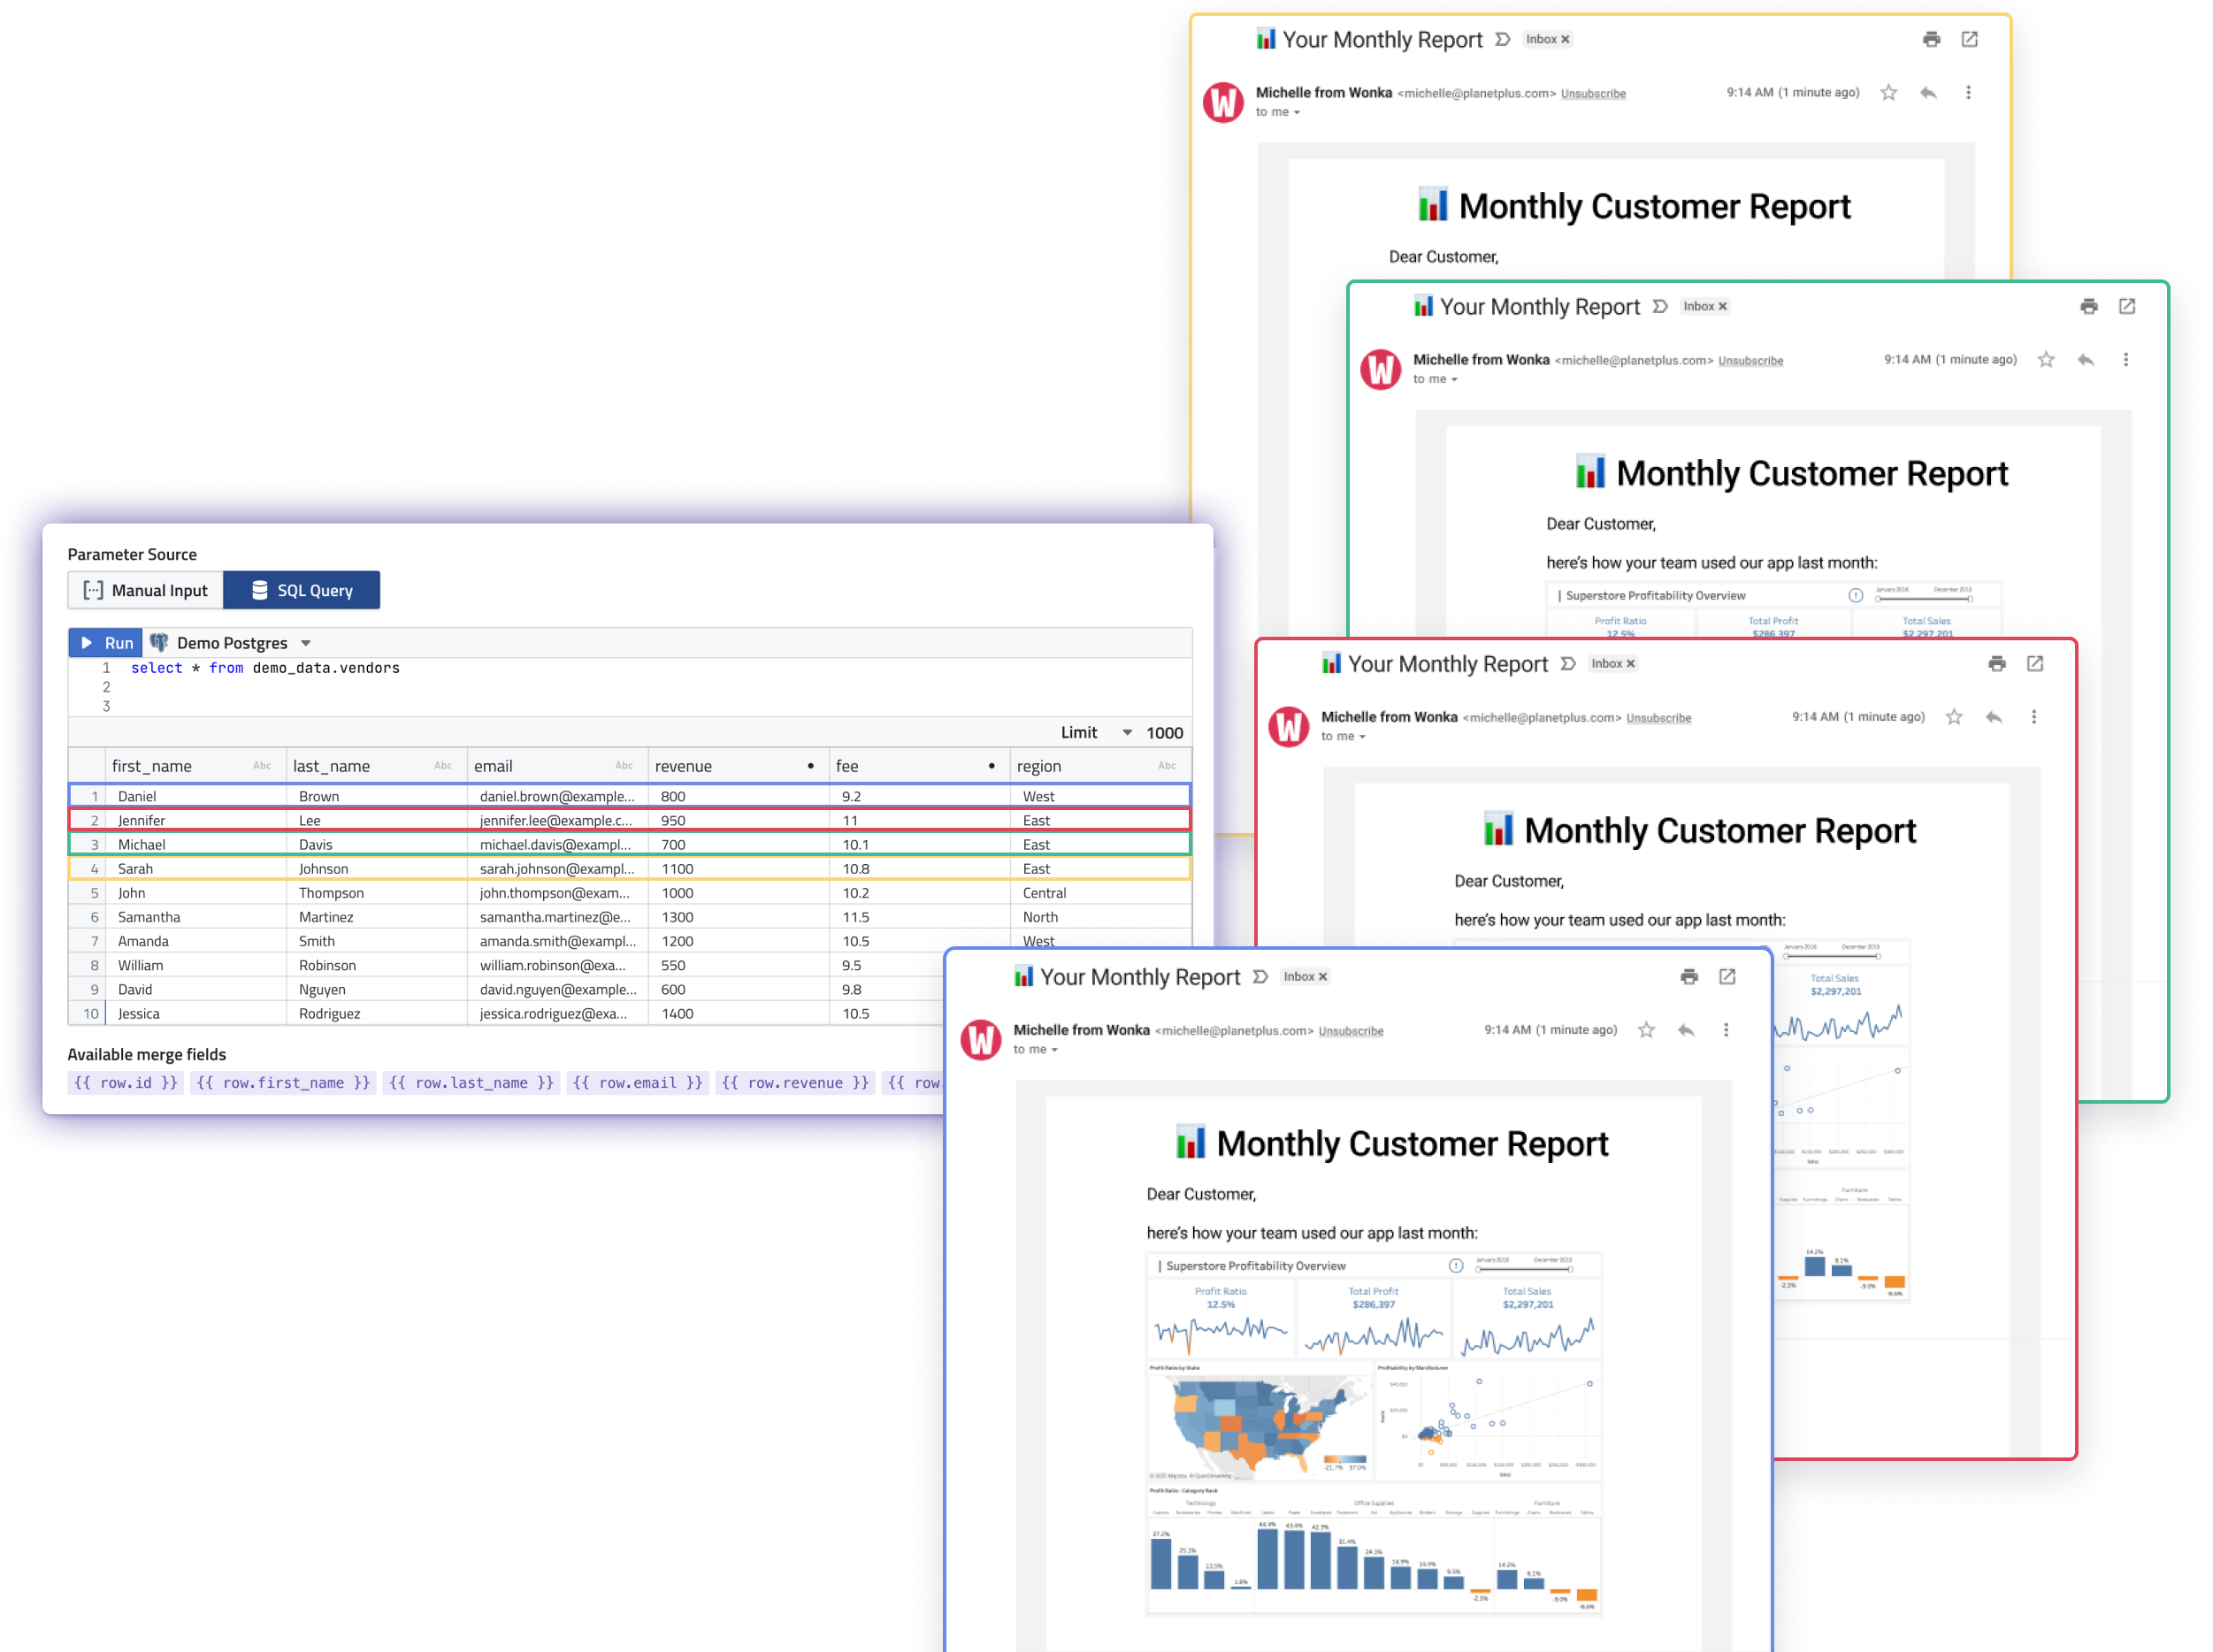
To send out a burst report to individual clients, building the visualization(s) first, and then adding a customer name filter would be just the way to customize a standard report. For each customer who should receive a report, it’s easy to reuse the same visualization by filtering on the customer’s name, and then using their email address or Slack name as the report recipient.
To create a management report, a combination of summary overview pages that include data output for drilling down can be included. Notice above, how simple it is to create multiple outputs of highly contextual information in a combined PDF with added CSV output for analysis.
Pro-Tip: The Automated Integrity Check
Using Webhooks to Pre-Approve Numbers Before Sending Reports
It’s common and often necessary in analytics and reporting to review information for accuracy and completeness before it gets sent out so that stakeholders are enabled to make the best decisions possible with the data provided.
PushMetrics comes with webhooks to enhance any reporting workflow by incorporating a process to approve the numbers before sending reports.
There’s nothing more embarrassing than sending out wrong numbers to important clients and stakeholders.
The webhook makes it possible to trigger reports to run even outside of the PushMetrics app. They can be effortlessly incorporated into any ETL process, or they can be simply copied into the message text when creating a report.
One pro tip we learned from one of our customers is that you can schedule a report that you send to yourself, which gives you the opportunity to validate the underlying data. After validation, the actual reports can be triggered with the webhook to send out to stakeholders, making the data checkup a one-click operation.
That wraps up a few quick, and simple report implementations that have the potential to enhance your reporting workflows, as well as, improve your end user experience. Creating reports from scratch isn’t always needed, and implementing these simple filtering and webhook techniques can save a lot of time, and give you the customization that your end users need.
Jump into your next report and give these features a try. Or get in touch to schedule a demo!
Kenneth Roos
Related Articles
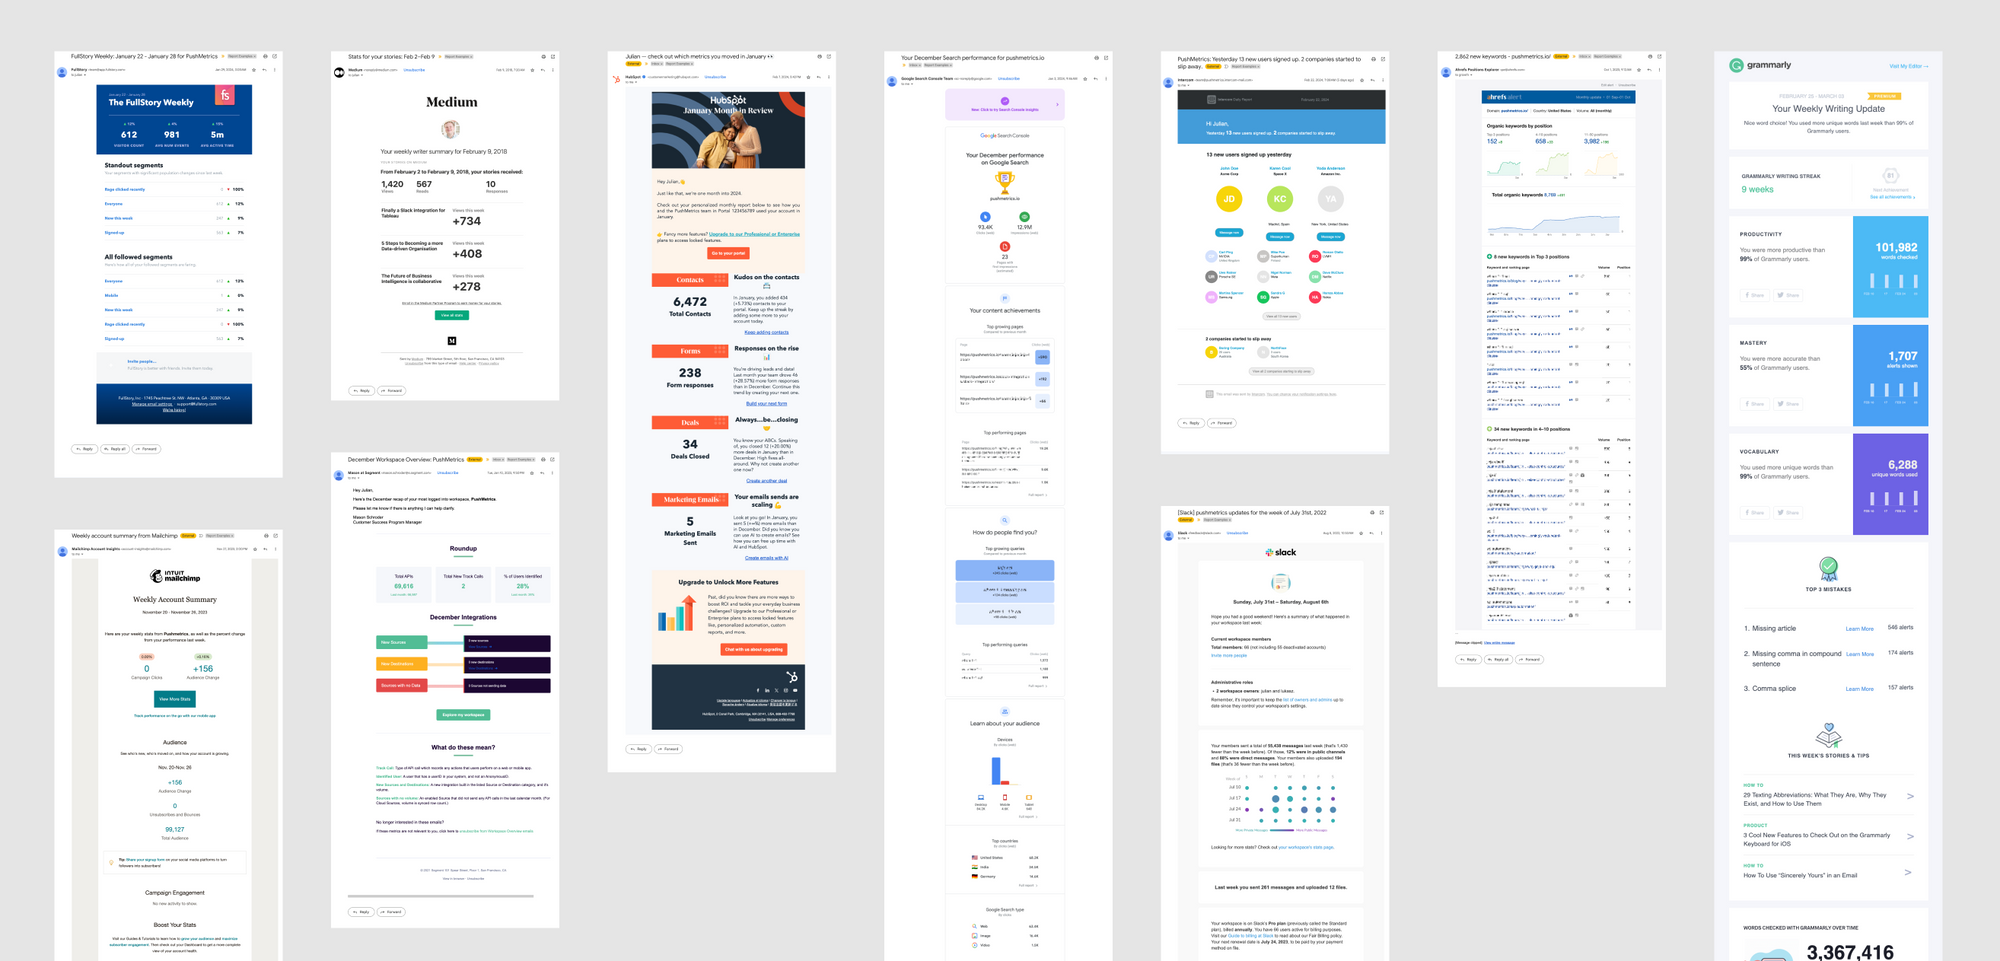
10 SaaS Usage Report Emails: How Companies Like Hubspot, Slack & Intercom Use Data To Maximize User Engagement
Product usage report emails are more than just automated messages; they're a window into how users interact with software, providing invaluable insights on engagement levels, feature adoption, and areas for improvement.

Julian Schulte
10 SaaS Usage Report Emails: How Companies Like Hubspot, Slack & Intercom Use Data To Maximize User Engagement
Product usage report emails are more than just automated messages; they're a window into how users interact with software, providing invaluable insights on engagement levels, feature adoption, and areas for improvement.
Julian Schulte
Subscribe to our newsletter
Get the latest updates from the PushMetrics team.
Thank you for subscribing.
Start sending data-driven messages today
Sign up and start using PushMetrics for free.
Or schedule a demo and discuss your use case.