4 Tips To Get Users More Engaged With Your Data
Master the art of engaging and impactful BI reporting. Learn key strategies to ensure your audience understands and acts on your data insights.
If you’ve ever had to create reports for a wider audience, you’ve probably encountered one of the most common problems in Business Intelligence; just because a colleague or customer asks for a report, it doesn’t mean they will read it, and it doesn’t mean they will understand the details like you.
If you want your organization to be focused on and engaged with your KPIs, we have a few tips for you:
1. Start Slow For Steady Progress
It’s quite likely that not everyone in your organization is comfortable interacting with data. Many others will likely not have the time to invest in digging into your report details when they just need a link to a fresh set of numbers with the refresh button. You want to make it easy for users to get started.
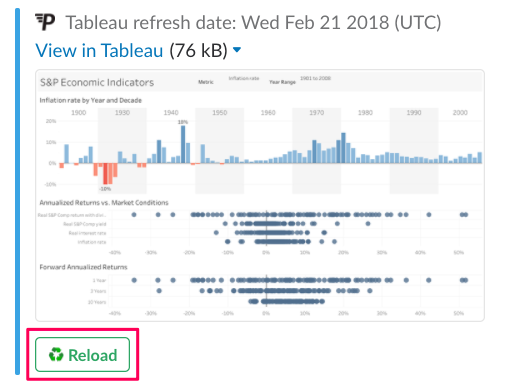
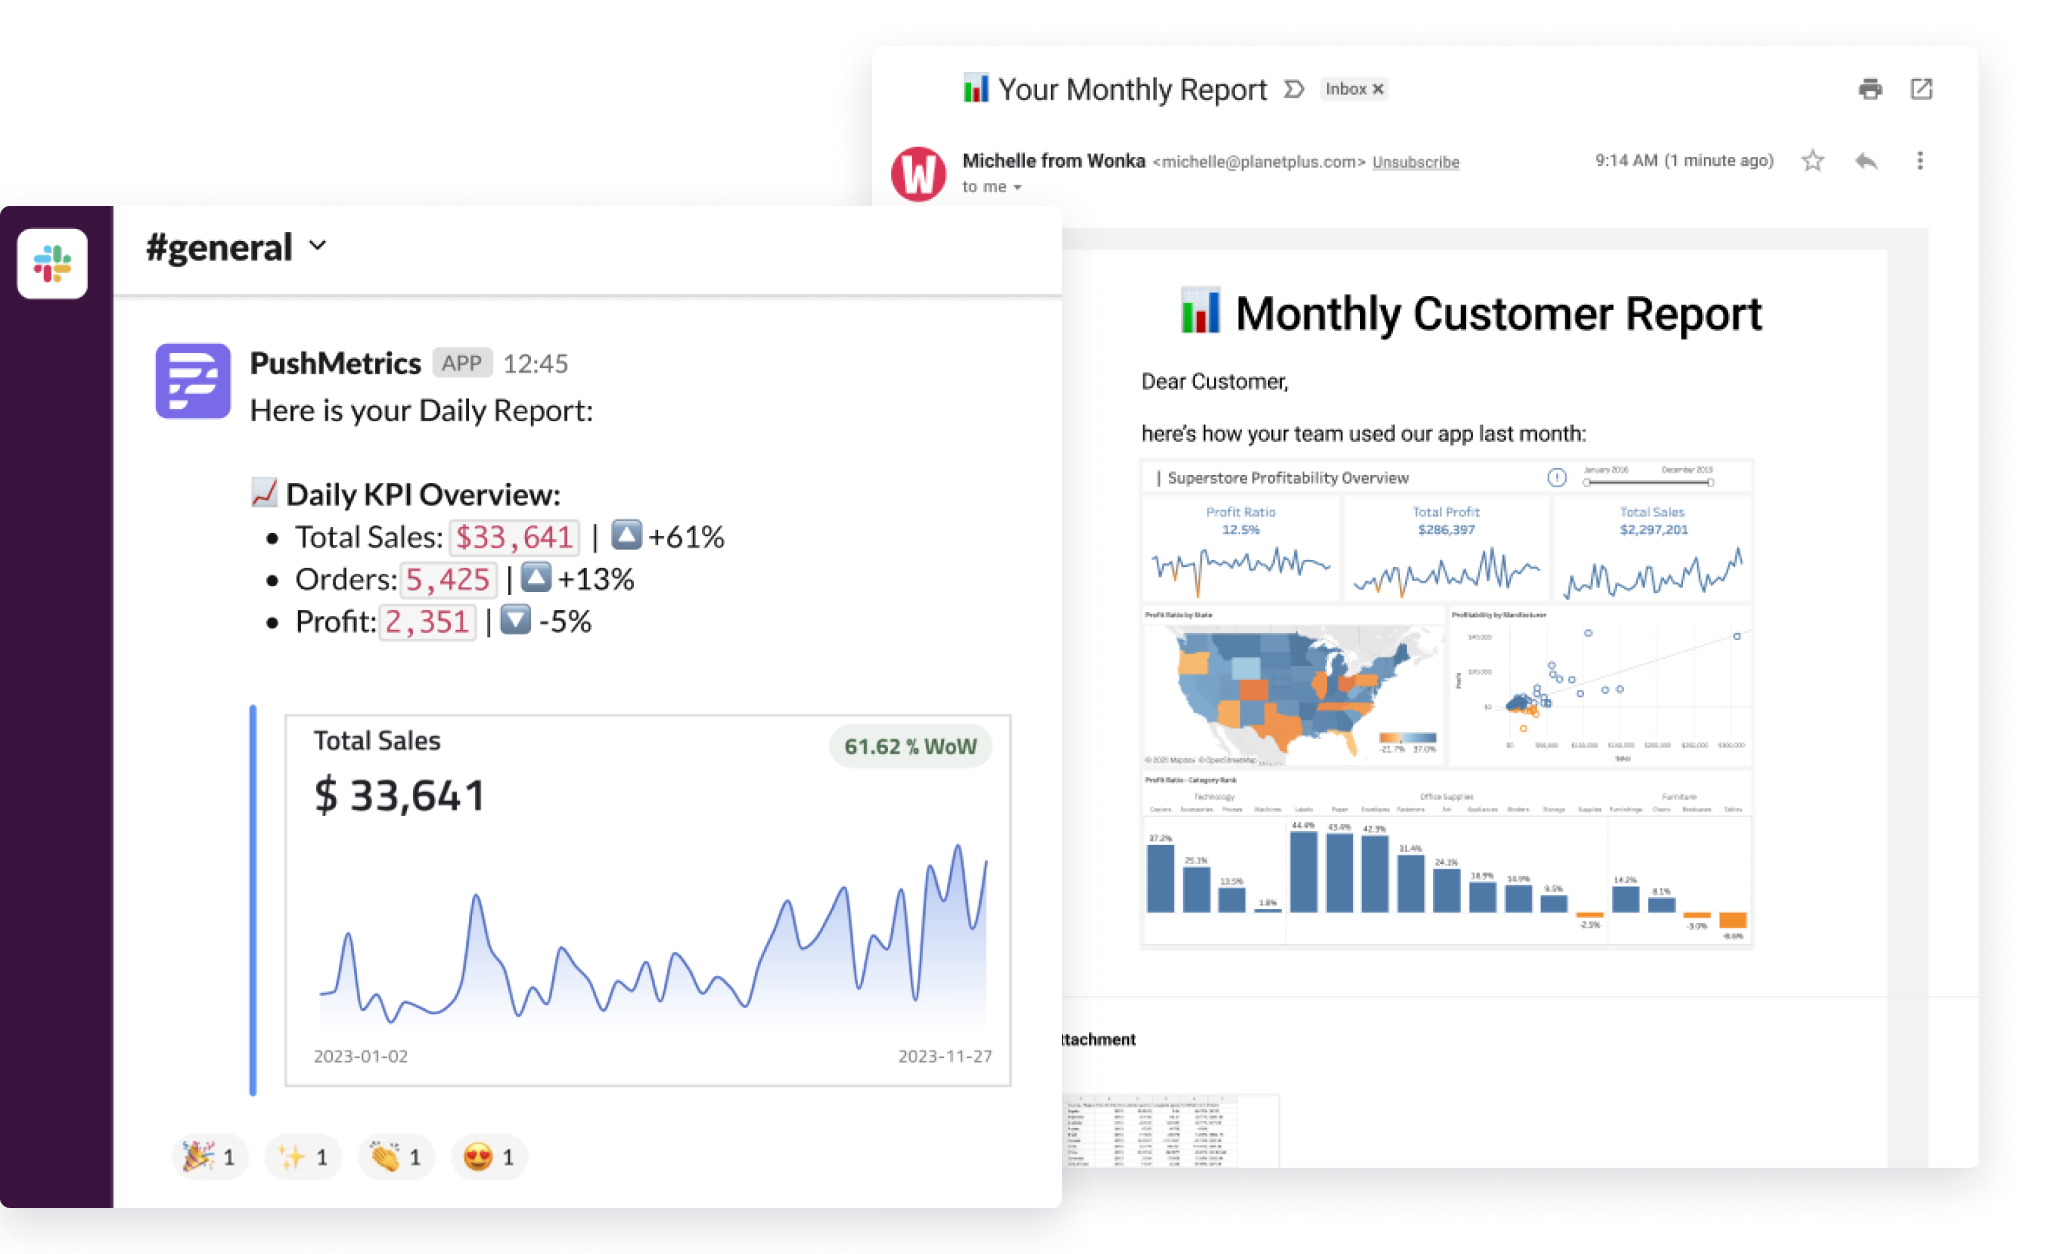
A prime example for this that we see widely adopted is the reload button in our PushMetrics Slack app. Subtle introductions to data make it easier for your organization to start interacting with data. Once they become more comfortable, you can encourage them to be more self sufficient, e.g. with easy to use searching and filtering in Slack or even building their own dashboards.
2. Keep It Relevant
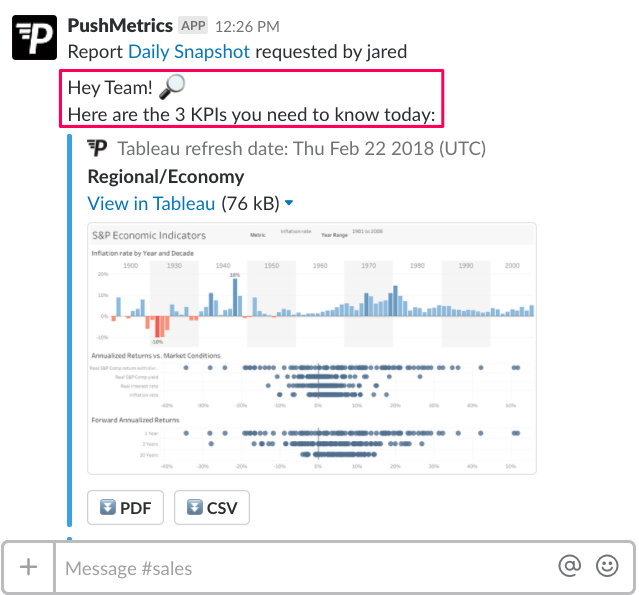
Introduce one or two key reports, rather than inundating users with information overload. It’s important to stay relevant, stay simple, and to stay focused on what you want end users to get out of your report. Not every user is ready for Tableau’s bells and whistles. PushMetrics addresses this by reducing the effort needed to make data actionable.
3. Focus on Frequent Feedback
Involving your stakeholders throughout and even after the development process will ensure that your reports will be impactful and actionable. If you keep your audience in the loop, they will spot ways to improve that you have missed.
Your report is only as effective as the number of people who decide to take action on the information you share, and it’s your job to make sure stakeholders are empowered to get there.
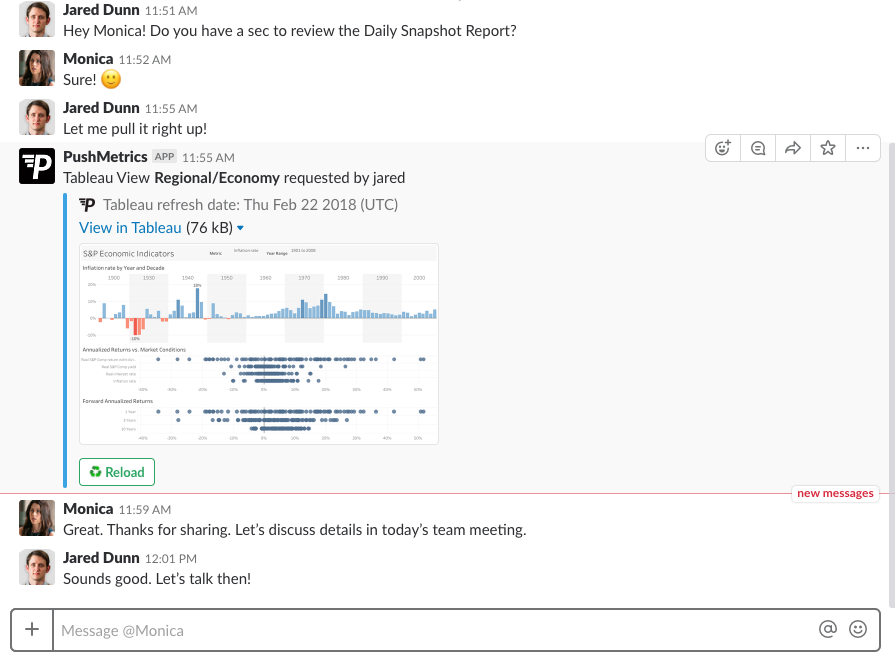
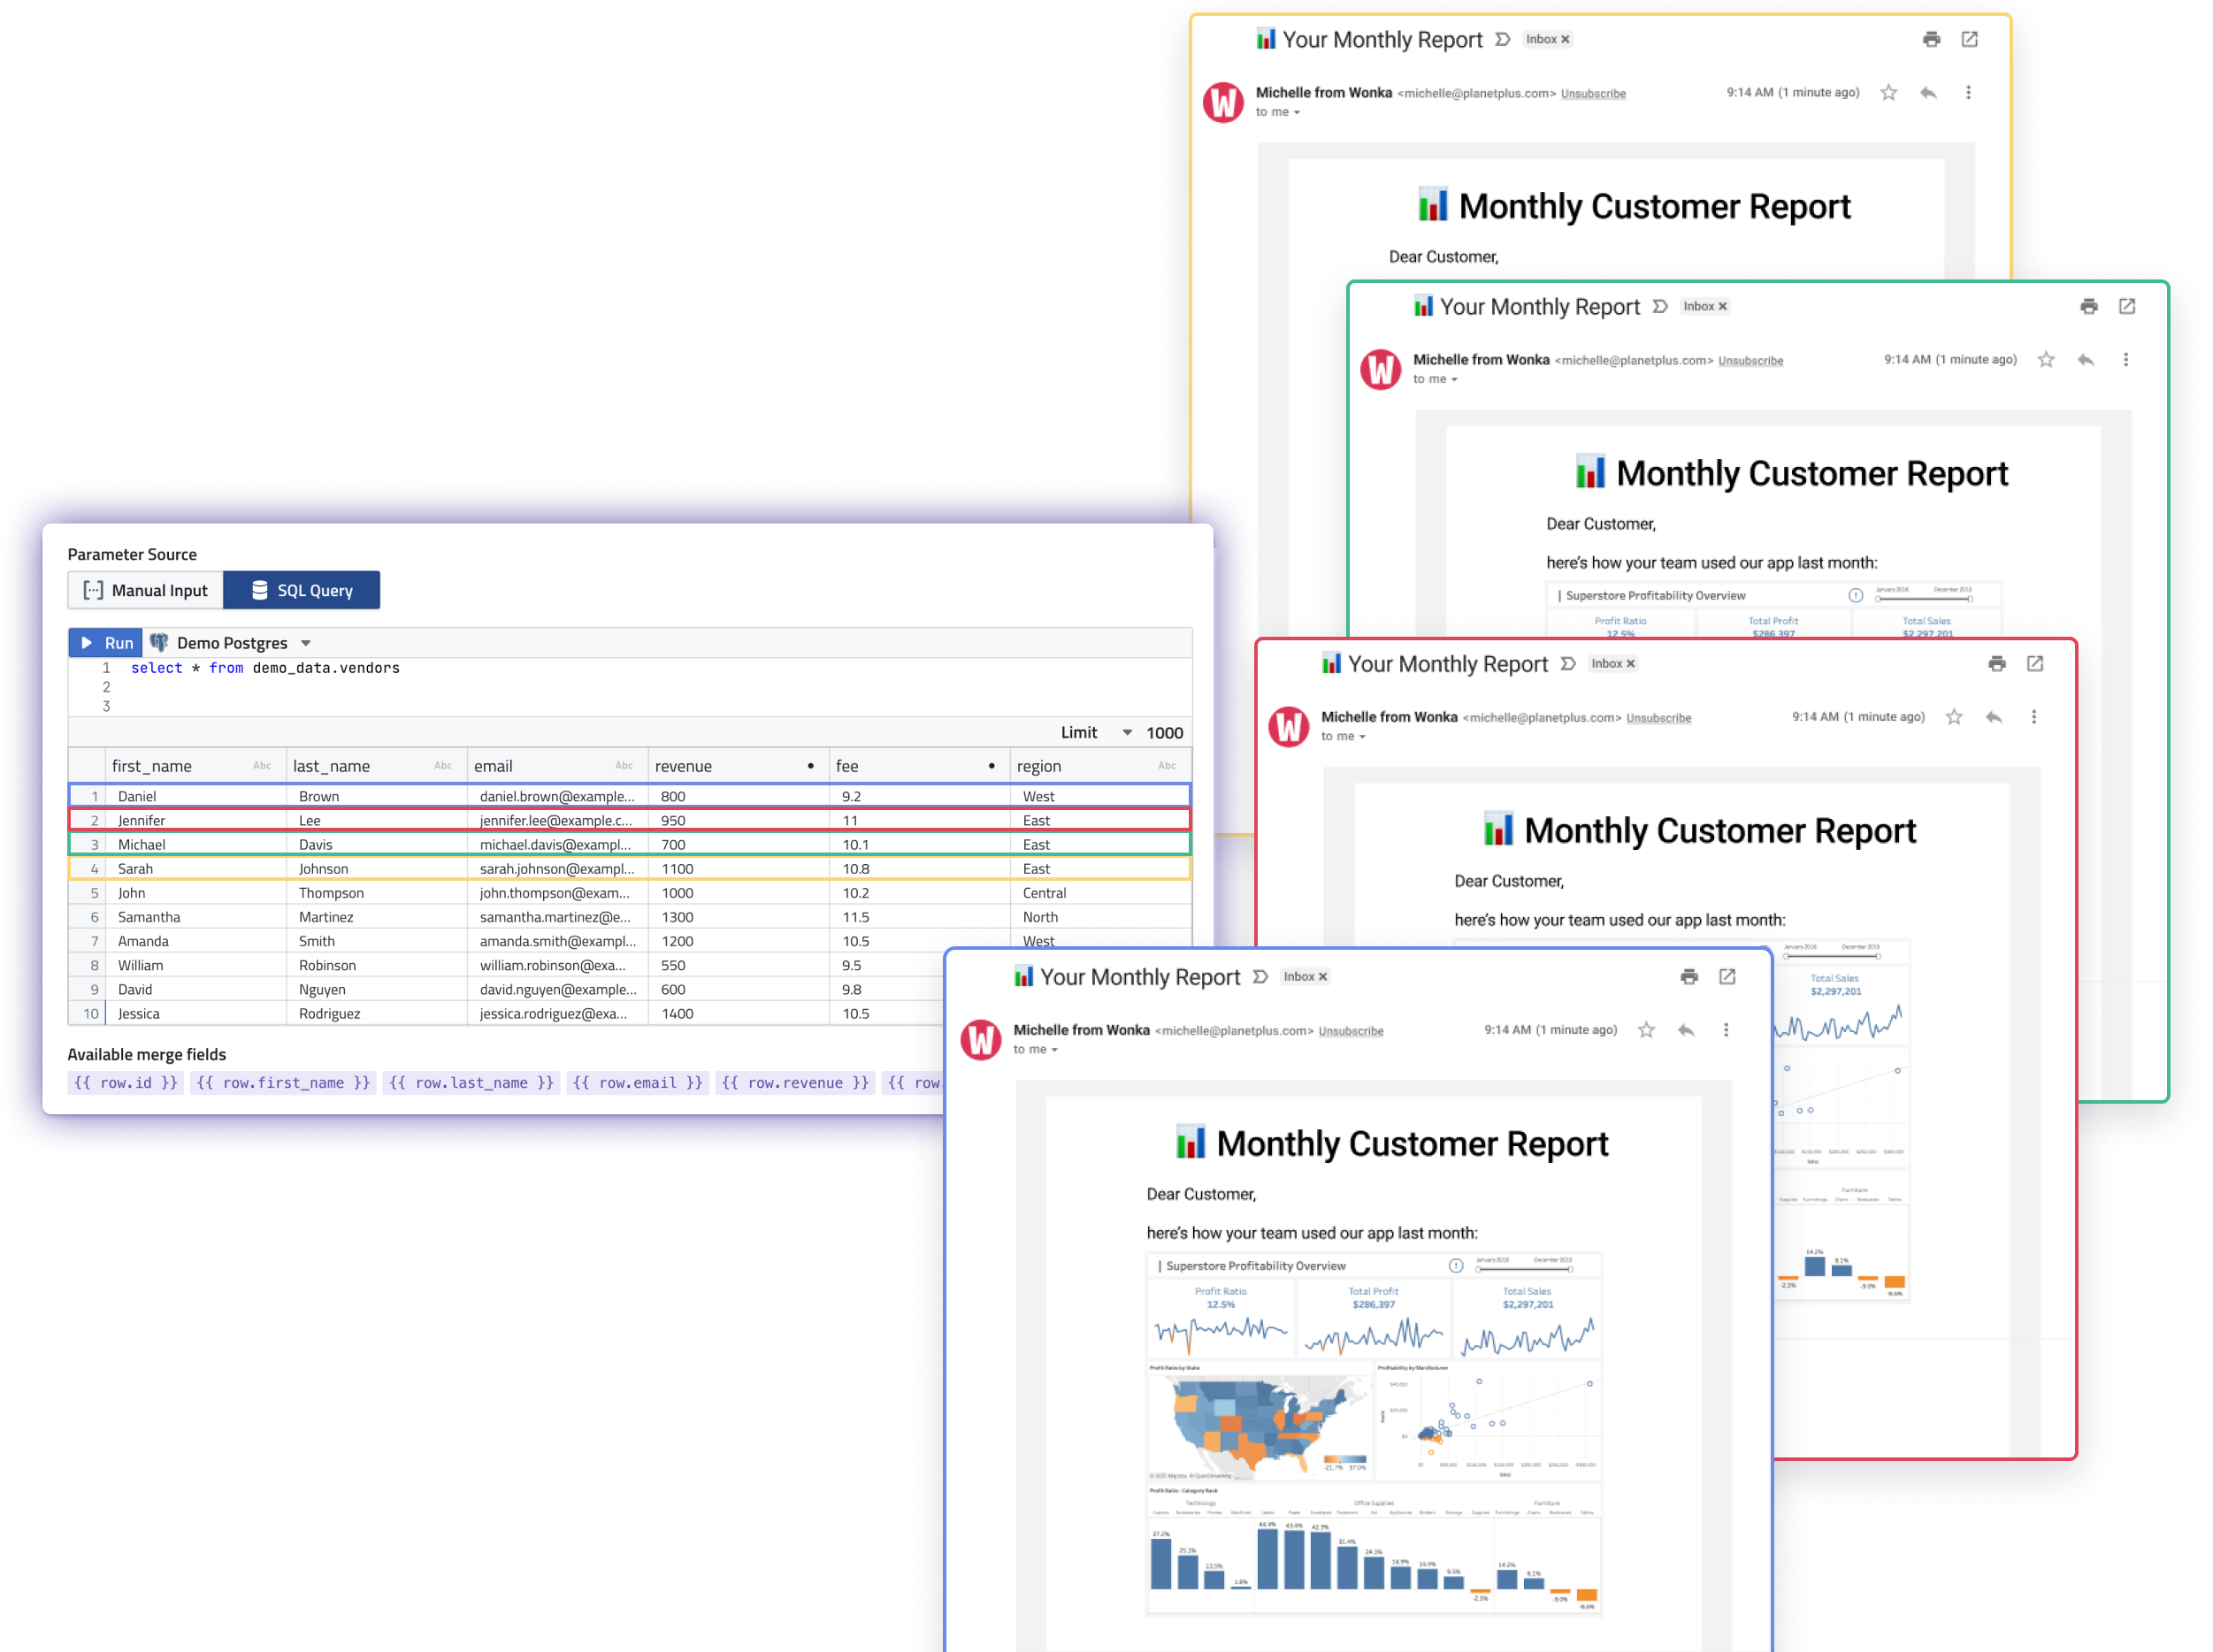
Got a new report draft ready for feedback? PushMetrics’ Slack and email integration makes it super easy to share Tableau views and dashboards ad-hoc in any channel.
4. Recurring Reports Reduce Resistance to Change
There is no better way to promote a perpetual data driven culture when you set up automated report deliveries. Repeated exposure to the same information is the quickest way to get users engaged with minimal effort.
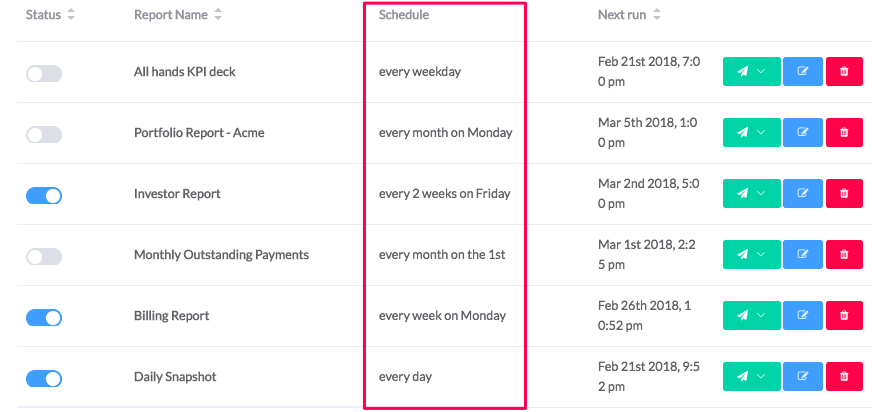
PushMetrics flexible report scheduling allow you to accommodate to your users and their needs.
Ready to take the next step?
Interacting with data doesn’t have to be a headache. Very simple user interfaces, and a few key action steps will help you optimize your reporting process in no time while keeping users focused and engaged!
Give PushMetrics a try, and let us know how your organization responds.
Kenneth Roos
Related Articles
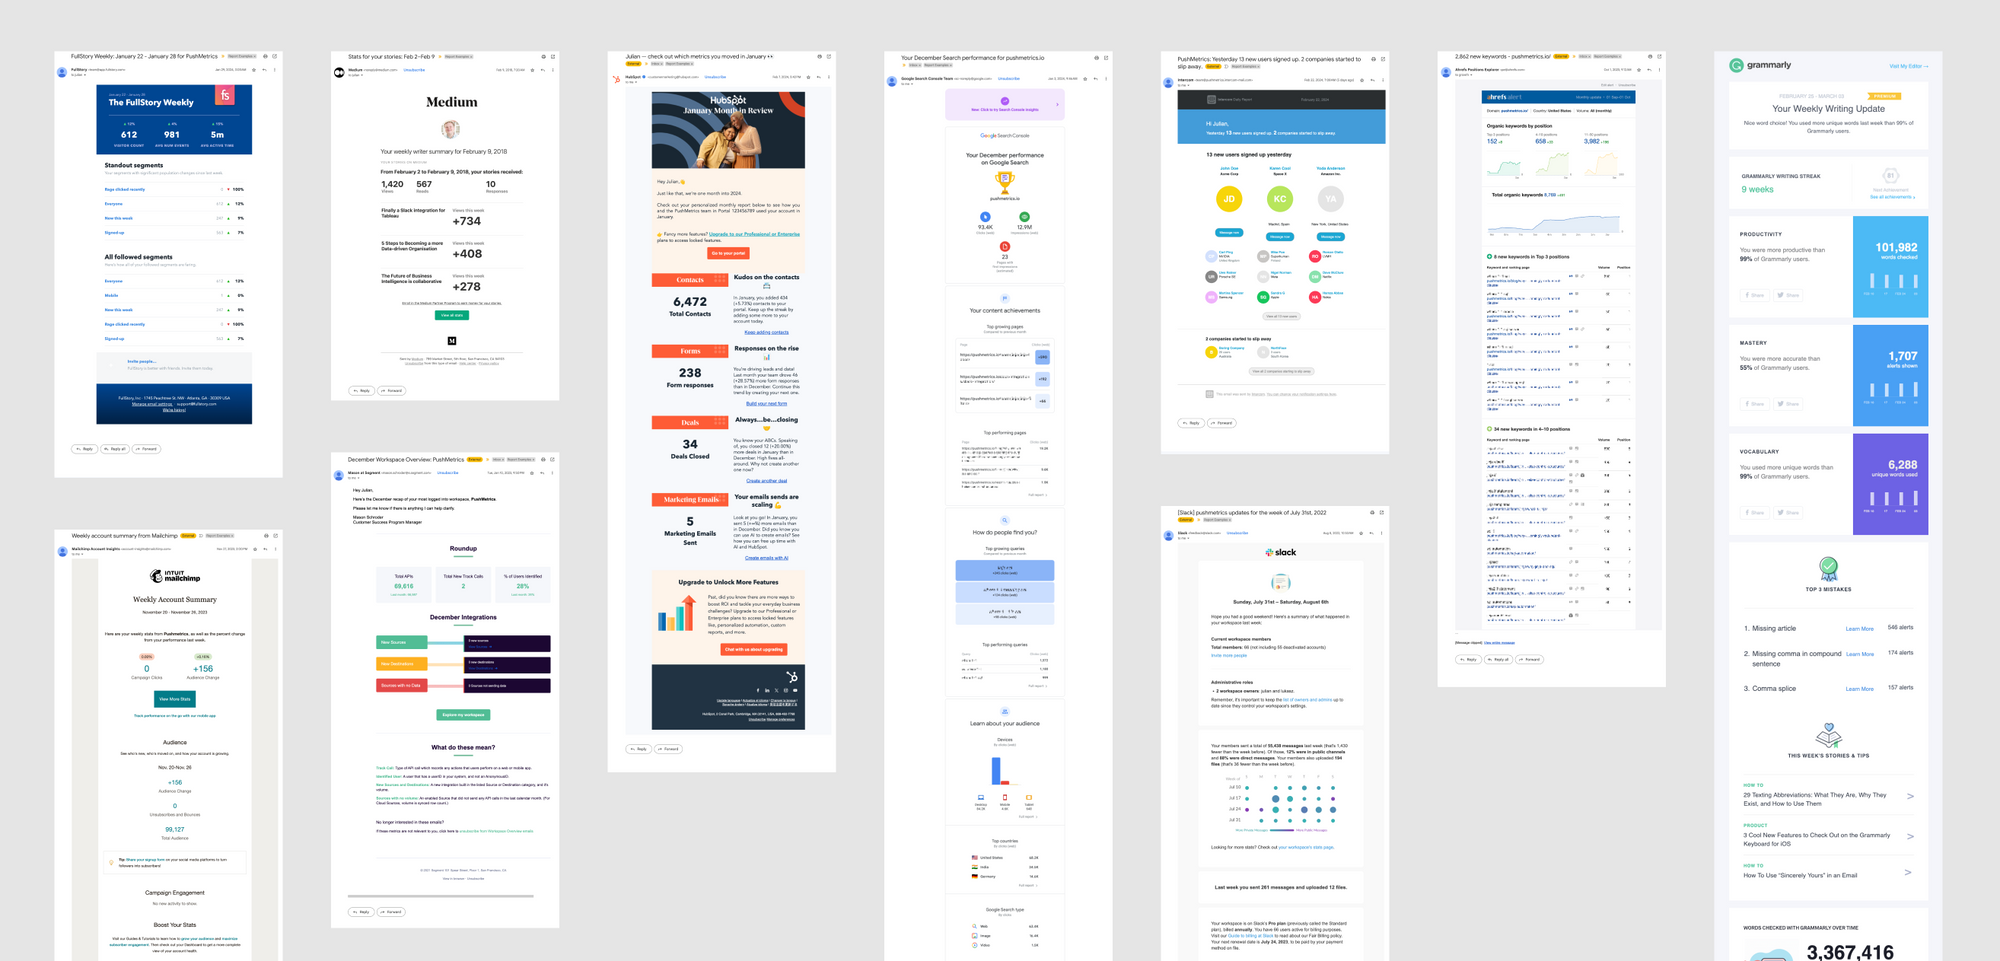
10 SaaS Usage Report Emails: How Companies Like Hubspot, Slack & Intercom Use Data To Maximize User Engagement
Product usage report emails are more than just automated messages; they're a window into how users interact with software, providing invaluable insights on engagement levels, feature adoption, and areas for improvement.

Julian Schulte
10 SaaS Usage Report Emails: How Companies Like Hubspot, Slack & Intercom Use Data To Maximize User Engagement
Product usage report emails are more than just automated messages; they're a window into how users interact with software, providing invaluable insights on engagement levels, feature adoption, and areas for improvement.
Julian Schulte
Subscribe to our newsletter
Get the latest updates from the PushMetrics team.
Thank you for subscribing.
Start sending data-driven messages today
Sign up and start using PushMetrics for free.
Or schedule a demo and discuss your use case.