Window functions
Window functions add another tool to our data analysis tool belt, enabling us to perform aggregations while retaining the original data in the result set: so, they are like aggregation functions, but more flexible in that we can also return columns unrelated to the aggregation!
Let’s jump straight into a practical example, where we want to see the sum of all invoice amounts next to the other columns of our (simplified) invoices table shown below, on the left side:
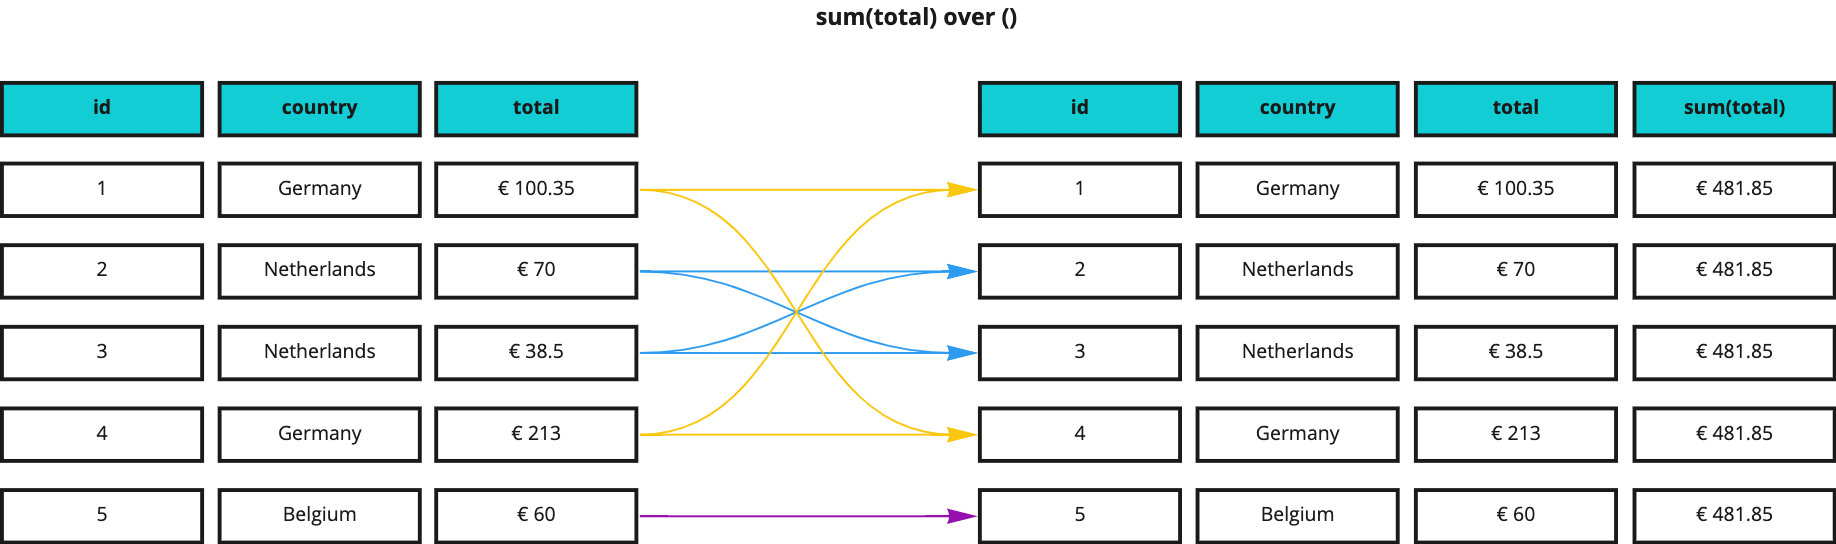
As you can see, the resultset on the right contains the very same columns and values as the original, plus one new column that always contains the same value: the sum of all invoice amounts.
A query to produce such a result would look like this:
SELECT
id,
country,
total,
sum(total) OVER ()
FROM learnsql.invoices;
Note: To keep examples as simple as possible, we’re now back to the initial database with a single table!
This query looks remarkably similar to the aggregation queries that we have seen previously, but there is an important difference: instead of the GROUP BY clause, there is an OVER () clause next to the aggregation function, which is our windowing clause and turns our function into a window function.
OVER () is the simplest form of windowing clause and essentially means: apply the aggregation over all rows in the table. You can think of this query as the equivalent of running the following two queries and then combining their results:
SELECT id, country, total FROM learnsql.invoicesSELECT sum(total) from learnsql.invoices
Partitioning
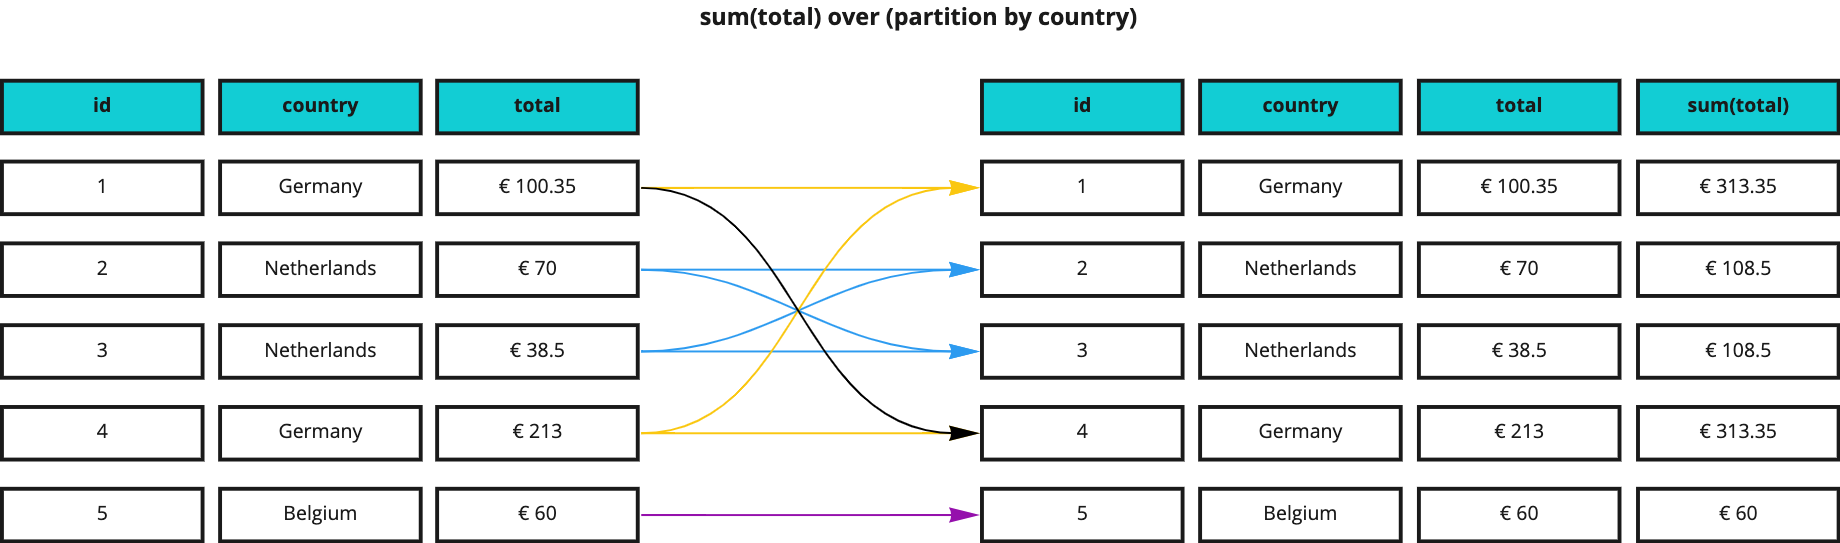
Let’s now say that we want to get the sum of invoice amounts per country, which would produce a result like this:
The query would now look as follows:
SELECT
id,
country,
total,
sum(total) OVER (PARTITION BY country)
FROM learnsql.invoices;
PARTITION BY brings grouping to window functions and the amount we now get is the total per country rather than the overall total.
Retaining access to the unaggregated data also enables us to see how it compares to aggregated data. For example, this query compares the total amount of each invoice with the overall amount per country, returning a value that indicates how much the invoice contributes, in percentage, to the total:
SELECT
id,
total,
sum(total) OVER (PARTITION BY country) AS total_by_country,
round(total / sum(total) OVER (PARTITION BY country), 3) * 100 AS percentage
FROM learnsql.invoices
ORDER BY 4 DESC;
We calculate the percentage by dividing the row total by the country total (= sum(total) OVER (PARTITION BY country)), then rounding the result to 3 decimal digits (for readability), and finally multiplying it by 100 to make it a proper percentage.
Ranking
Window functions can also help us assign a rank to our query results, based on their values. For example, the following query ranks business customers so that, in each country, the customer with the highest invoice will be ranked first, the one with the second highest invoice will be ranked second, and so on:
SELECT
id,
business_name,
country,
total,
dense_rank() OVER (PARTITION BY country ORDER BY total DESC) AS ranking
FROM learnsql.invoices
WHERE business_name IS NOT NULL
ORDER BY 3, 5;
This time we’re using the dense_rank function and, in addition to partitioning by country, we’re sorting by total in descending order within each group, to have the highest value first.
References:
Practice
Are you ready to practice what you’ve just learned? Head over to the Notebook and try to solve the exercises you find there!
Note: the solution to each exercise is in the collapsed block right below it: you can expand it by clicking the arrow icon that appears on the far left when you hover it.